


A Falling Wedge Chart Pattern formed by drawing two descending trend lines, one representing highs and one representing lows.
It is categorized as a bullish reversal chart pattern.
The slope of the trend line representing the highs is lower than the slope of the trend line representing the lows, indicating that the highs are decreasing more rapidly than the lows.
It takes at least five reversals (two for one trend line and three for the other trend line) to form a good Falling Wedge pattern.
The resulting shape forms a gradually narrowing wedge, giving this pattern its name.
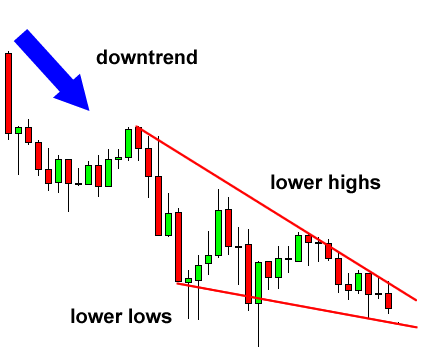
Because the trend lines that describe the falling wedge are descending, falling wedges are occasionally falsely thought of as continuation patterns for an overall downward trend.
The seeming downward trend in price invites bearish traders to continue selling, while bullish traders continue buying which maintains the strong lower line of support.
Since the price refuses to break the lower level of support, selling pressure gradually decreases, the upper level of resistance is broken, and the price breaks out and begins a strong upward trend.
The falling wedge should be taken as a strong buy signal and an indication that a trend reversal is imminent.
A falling wedge is the opposite of a rising wedge.
Falling wedges often come after a climax trough (sometimes called a “panic”), a sudden reversal of an uptrend, often on heavy volume.
In this scenario, price within the falling wedge is usually not expected to fall below the panic value, ending up in breaking through the upper trend line.
During the pattern formation, volume is most likely to fall.
Better performance is expected in wedges with high volume at the breakout point.
Gaps before the breakout are also said to improve the performance.
In the uncommon scenario where a falling wedge is following an uptrend, the pattern shows a gradual decline in price. In most cases, the price will end up breaking through the upper line, continuing the prior trend.
If you liked this article, then please subscribe to our Newsletter Services for Forex Related updates. You can also find us on Facebook and can subscribe to our YouTube channel. You can also join our Telegram Channel for real-time trading analysis and discussion. Here is our service sitemap. If you have any confusion please leave your comments below.


