

A trend line is a chart pattern that is defined as a series of highs or lows that form a straight line.
It is constructed by joining two or more price points with a straight line.
The purpose of a trend line is to identify the historical trend of the price movements and to indicate support and resistance levels.
In technical analysis, it is one of the basic components of other chart patterns such as trend channels, wedges, flags, and triangles.
Trend lines are used:
- To identify and confirm trends
- To predict levels of support and resistance
Trend lines can be composed of highs (resistance) or lows (support).
To construct a trendline, simply connect either the high prices or low prices on a price chart. The resulting line is the trend line.
The trend line is usually extended forward to identify sloped areas of support and resistance.
Trend lines are literally a visual representation of support and resistance levels.
Only two points are necessary to draw a trend line, but the more points that are used in constructing the line, the stronger the trend line becomes.
Types of Trend Lines
There are two types of trendlines: ascending and descending.
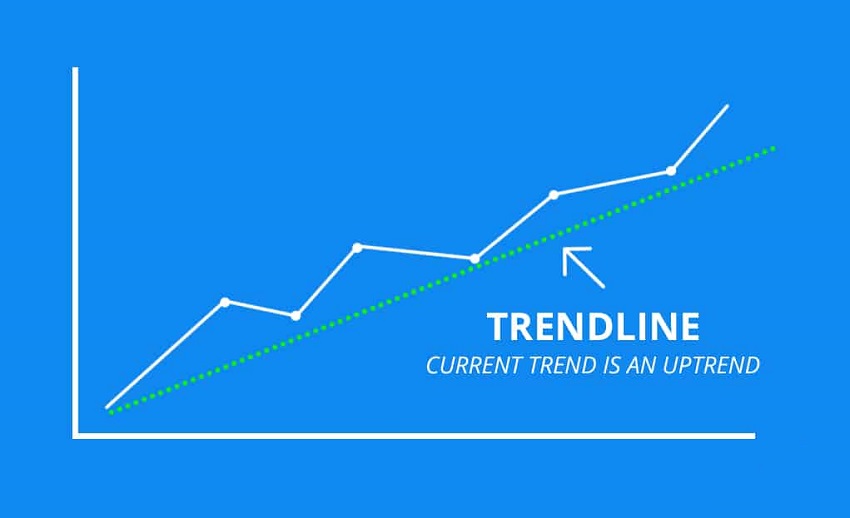
Ascending Trend Line
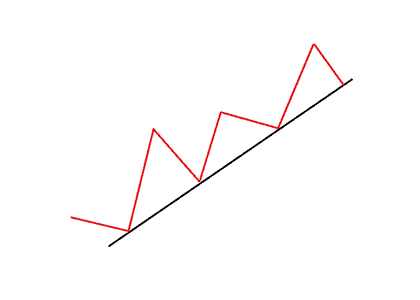
An ascending trend line or uptrend line is formed by connecting the lows, where the more recent low price is higher than the previous low price.
An ascending trend line extends into the future and can be thought of as a level of support.
Lines with a positive slope that support price action show that demand (more buyers than sellers) is increasing.
As long as the price action stays above this line, we have a bullish trend
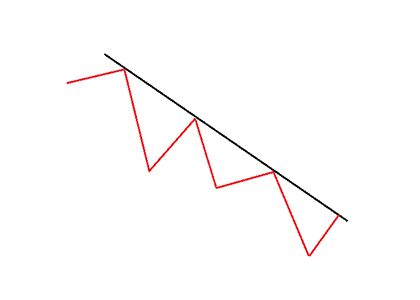
A descending trend line or downtrend line is exactly the opposite of an ascending trend line.
It is formed by connecting the highs, where the more recent high is lower than the previous high.
A descending trend line extends into the future and can be thought of as a level of resistance.
Lines with a negative slope that act as resistance to the price action show that supply (more sellers than buyers) is increasing.
As long as the price action stays under this line, we have a bearish trend.
Trend Line Breaks
The popular approach to trading trend lines is that if price bounces upward off trend line’s support, and downward off a trend line’s resistance.
Price usually retests a sloped trend line several times, until it breaks.
When a trendline is broken, especially with high volume, the momentum will push the price significantly above/below the broken trendline.
When this happens, this signals a trend reversal.
Traders have different opinions on how far apart connected price points can be and whether the trend line should connect to a candlestick’s wick or body.
Regardless of your approach to constructing trend lines, just know that all trend lines eventually break.
If you liked this article, then please subscribe to our Newsletter Services for Forex Related updates. You can also find us on Facebook and can subscribe to our YouTube channel. You can also join our Telegram Channel for real-time trading analysis and discussion. Here is our service sitemap. If you have any confusion please leave your comments below.


