

A Rising Wedge Chart Pattern is formed by drawing two ascending trend lines, one representing highs and one representing lows.
The upper line also moves up to the right and its slope is less than that of the lower trend line.
A rising wedge typically has at least five reversals: three for one trend line and two for the opposite trend line.
Rising Wedge Chart Pattern is categorized as a bearish reversal chart pattern.
The slope of the trend line representing the highs is lower than the slope of the trend line representing the lows, indicating that the lows are increasing more rapidly than the highs.
The resulting shape forms a gradually narrowing wedge, giving this chart pattern its name.
Because the trend lines that describe the rising wedge are ascending, rising wedges are occasionally falsely thought of as continuation patterns for an overall upward trend.
The seeming upward trend in price invites bullish traders to continue buying, while bearish traders continue selling off their holdings which maintains the strong upper line of resistance.
Since the price refuses to break the upper level of resistance, buying pressure gradually decreases, the lower level of support is broken, and the price breaks down and begins a strong downward trend.
The rising wedge should be taken as a strong sell signal and an indication that a trend reversal is imminent.
A rising wedge is the opposite of a falling wedge.
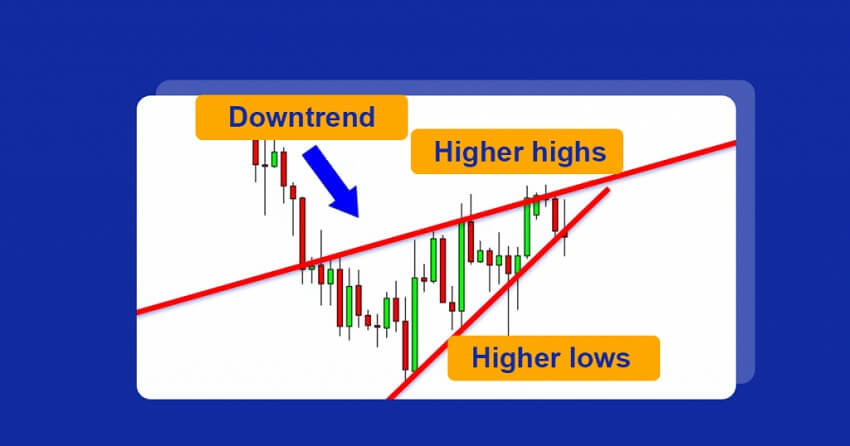
When following a downtrend, the rising wedge shows a weak rally which, in most cases, will end up breaking through the lower line, continuing the prior trend.
Upward breakouts are less common, but do happen and are more probable than downward breakouts in falling wedges.
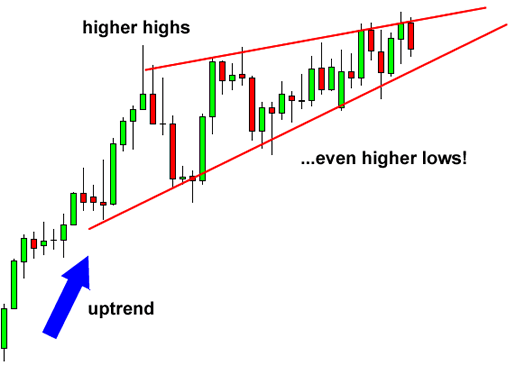
Watch out for when the Rising Wedge accompanies an uptrend: Its versatile nature can make it a reversal pattern, not a continuation pattern as it typically is.
Breakouts are generally expected in the second half of the pattern, closer to the middle. As the pattern forms, volume is most likely to fall.
If you liked this article, then please subscribe to our Newsletter Services for Forex Related updates. You can also find us on Facebook and can subscribe to our YouTube channel. You can also join our Telegram Channel for real-time trading analysis and discussion. Here is our service sitemap. If you have any confusion please leave your comments below.


