

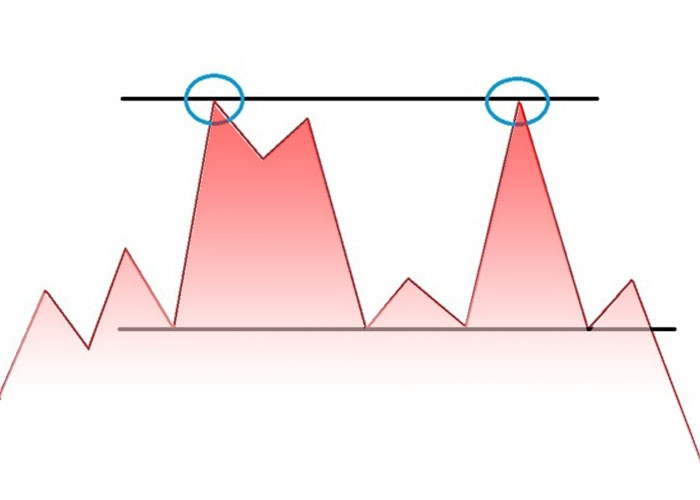
A Double Top is a chart pattern where the price reaches a high twice and fails to break out higher during the second attempt.
The pattern comprises two peaks of nearly the same size and a bottom between them.
The line running through the tops is the resistance line which should be nearly horizontal.
The pattern forms an “M” shape and is considered a bearish reversal chart pattern.
The pullback between the two highs should be moderate.
This new minor support level is called the “Neckline“.
The pattern is confirmed once the price breaches the low of the pullback between the two highs.
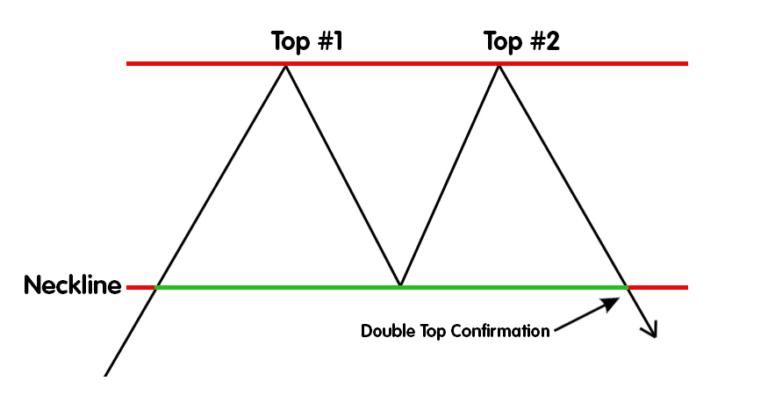
Double Tops appear in an uptrend and reverse it to the downside as price breaks through the support line (Neckline).
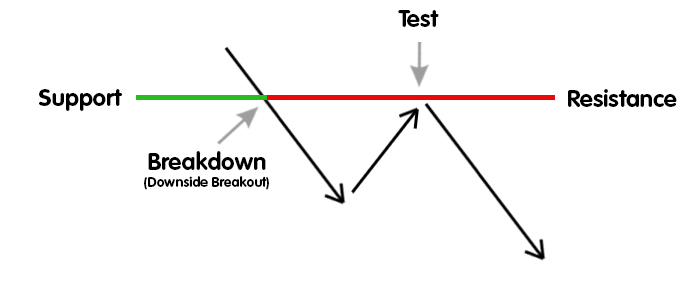
A more conservative approach is to wait for the price to test the Neckline.
The Neckline has now become a support-turned-resistance level.
If you liked this article, then please subscribe to our Newsletter Services for Forex Related updates. You can also find us on Facebook and can subscribe to our YouTube channel. You can also join our Telegram Channel for real-time trading analysis and discussion. Here is our service sitemap. If you have any confusion please leave your comments below.


