

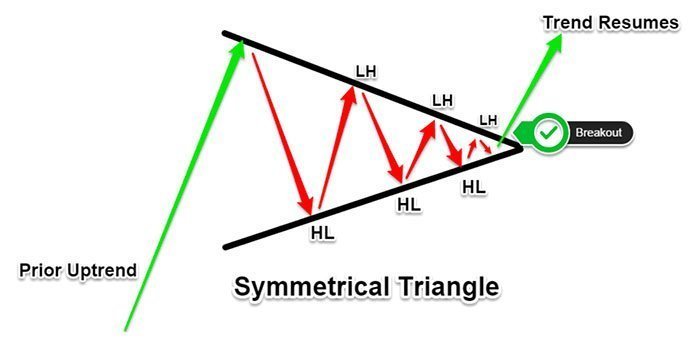
A Symmetrical Triangle is a neutral chart pattern that can offer opportunities for both long and short traders depending on which side price breaks out.
A symmetrical triangle results when there is an area of indecision within the marketplace where buyers are attempting to push prices higher but are met with resistance by sellers.
The market reaches a pause as the direction of prices is questioned, typically because the forces of both sellers and buyers are equal.
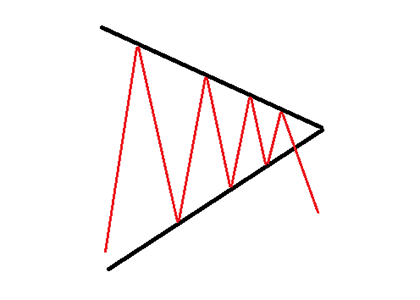
A series of rallies and sell-offs continues, each one smaller than the last, and the triangle gradually eases upward.
When these points are connected, the lines converge as they are extended and the symmetrical triangle takes shape.
The chart pattern contains at least two lower highs and two higher lows.
The range of price increasingly narrows by making a series of higher lows and lower highs and this is caused by growing indecisiveness in the market.
Such a pattern can form during a period before a significant news announcement the market is expecting and illustrates how traders are awaiting information before they make their next move.
Tension builds as price consolidates towards the apex and traders are waiting to jump in if either trend line is broken.
Eventually, the area of indecision is resolved and the formation explodes, usually with an increase in volume.
If you liked this article, then please subscribe to our Newsletter Services for Forex Related updates. You can also find us on Facebook and can subscribe to our YouTube channel. You can also join our Telegram Channel for real-time trading analysis and discussion. Here is our service sitemap. If you have any confusion please leave your comments below.


