

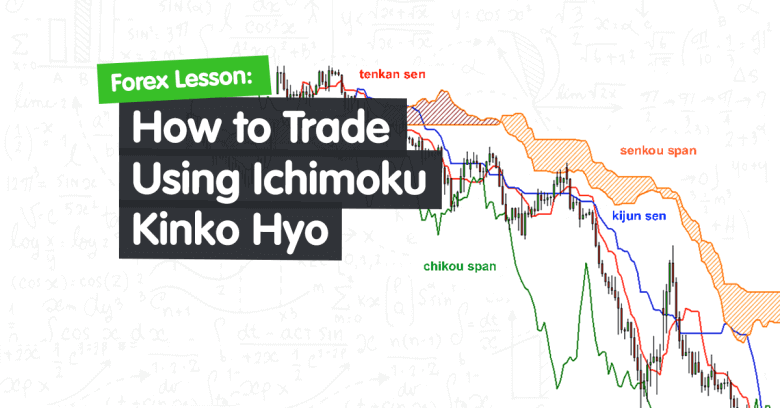
Ichimoku Kinko Hyo
Ichimoku roughly translates to “one glance” since it is meant to be a quick way to see how the price is behaving on a chart
Its full name, Ichimoku Kinko Hyo means” equilibrium chart at a glance”.
Ichimoku Kinko Hyo was developed by Goichi Hosoda and released in 1968, although the chart didn’t gain popularity in the West until the 1990s.
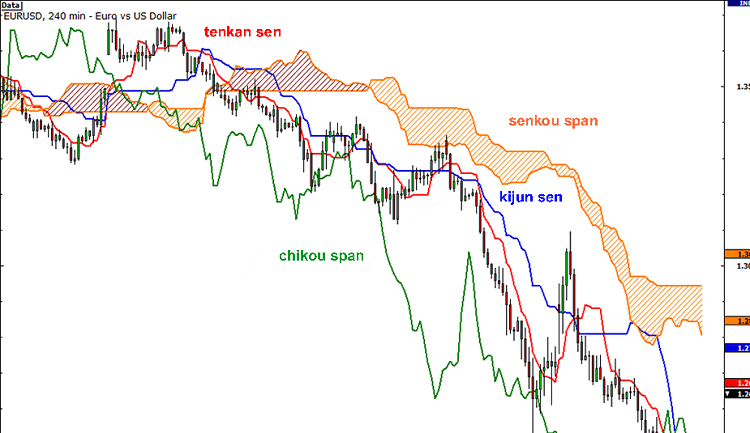
Ichimoku Kinko Hyo is composed of five lines.
- Tenkan-sen averages the highest high and lowest low and is calculated over a fairly short period of time (seven to nine periods.)
- Kijun-sen uses the same equation but is calculated over twenty-two periods.
- Chikou Span plots the current closing price a full twenty-two periods behind.
- Senkou Span A-averages Tenkan-sen and Kijun-sen, and are plotted twenty-six periods ahead.
- Senkou Span B averages the highest high and lowest low over the last fifty-six periods and is plotted twenty-two periods ahead.
- Kumo is the space between Senkou Spans A and B.
Traders use Ichimoku Kinko Hyo to generate a variety of signals for market behavior, based on the interaction of the chart’s lines with the Kumo.
Because of the comprehensiveness of the chart, traders consider it to be a very powerful tool for technical analysis.
However, foreign exchange traders should be aware of the chart’s drawbacks in forex markets: since forex markets never close, no close prices are generated, and it’s unclear how the Chikou Span should be plotted.
Good judgment should therefore be used both in choosing the time periods from which to generate the chart and in deciding which price should be chosen as a forex market’s close price.
Definition
Ichimoku Kinko Hyo (IKH) is an indicator that gauges future price momentum and determines future areas of support and resistance. Now that’s 3-in-1 for y’all! Also, know that this indicator is mainly used on JPY pairs.
Putting that all together, the phrase ichimoku kinko hyo stands for “a glance at a chart in equilibrium.”
Huh, what does all that mean?
A chart might make things easier to explain…

Whoops. That didn’t help. A few more lines and will resemble a seismograph. Before you go off and call this gibberish, let’s break down the components of Ichimoku Kinko Hyo so it’s easy to understand.
But before we do that, there are a couple of things about this indicator that you should know about first:
- Ichimoku can be used in all time frames for any tradeable asset. (It was originally used to trade rice!)
- Ichimoku can be used in both rising and falling markets.
So when CAN’T you use Ichimoku?
When no clear trend exists.
Basically, when the market is trading sideways, choppy, aka trendless.
You’ll know it’s trendless when the price is oscillating on either side of the cloud.
Got it! Excellent.
Now let’s try to find out what each of the lines is for.
Calculation
Kijun Sen (blue line): Also called the standard line or baseline, this is calculated by averaging the highest high and the lowest low for the last 26 periods.
Tenkan Sen (red line): This is also known as the turning line and is derived by averaging the highest high and the lowest low for the past nine periods.
Chikou Span (green line): This is called the lagging line. It is today’s closing price plotted 26 periods behind.
Senkou Span (orange lines): The first Senkou line is calculated by averaging the Tenkan Sen and the Kijun Sen and plotted 26 periods ahead.
The second Senkou line is determined by averaging the highest high and the lowest low for the last 52 periods and plotted 26 periods ahead.
Got it? Well, it’s not really necessary for you to memorize how each of the lines is computed.
What’s more important is for you to know how to interpret these fancy lines.
Trading Usage
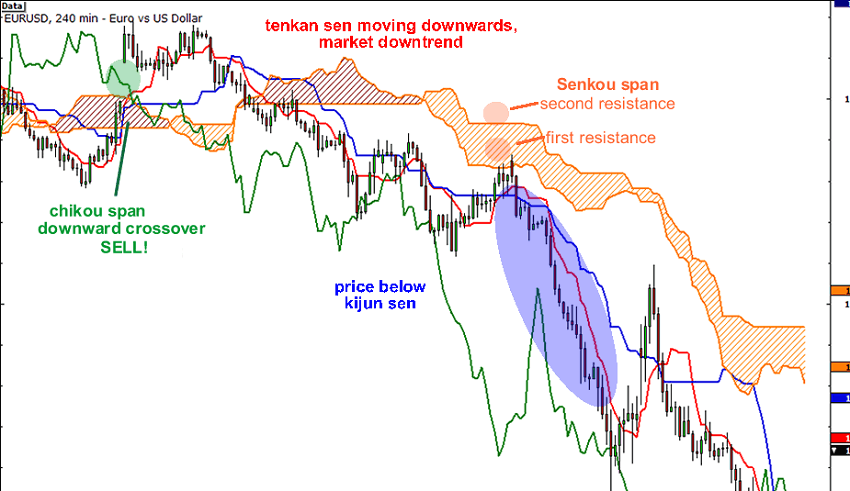
Senkou
Let’s take a look at the Senkou span first.
If the price is above the Senkou span, the top line serves as the first support level while the bottom line serves as the second support level.
If the price is below the Senkou span, the bottom line forms the first resistance level while the top line is the second resistance level. Got it?
Kijun Sen
Meanwhile, the Kijun Sen acts as an indicator of future price movement.
If the price is higher than the blue line, it could continue to climb higher.
If the price is below the blue line, it could keep dropping.
Tenkan Sen
The Tenkan Sen is an indicator of the market trend.
If the red line is moving up or down, it indicates that the market is trending.
If it moves horizontally, it signals that the market is ranging.
Chikou Span
Lastly, if the Chikou Span or the green line crosses the price in the bottom-up direction, that’s a buy signal.
If the green line crosses the price from the top-down, that’s a sell signal.
Here’s that line-filled chart once more, this time with the trade signals:
It sure looks complicated at first but this baby’s got support and resistance levels, crossovers, oscillators, and trend indicators all in one go! Amazing, right? As a trend following indicator, Ichimoku can be used in any market, in any timeframe. Regardless of the market, Ichimoku emphasizes trading in the direction of the trend and NOT against the trend.
By following trends, Ichimoku can help you to avoid entering the wrong side of where the market.
If you liked this article, then please subscribe to our Newsletter Services for Forex Related updates. You can also find us on Facebook and can subscribe to our YouTube channel. You can also join our Telegram Channel for real-time trading analysis and discussion. Here is our service sitemap. If you have any confusion please leave your comments below.


