


Introduction
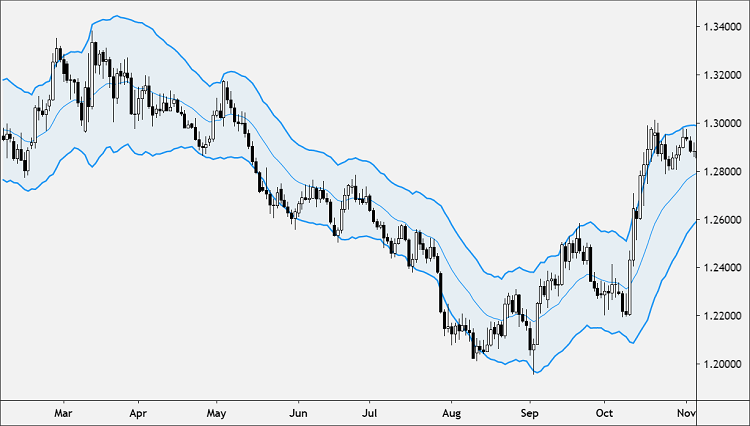
The Keltner Channel or KC is a technical indicator that consists of volatility-based bands (or channels) set above and below a moving average.
The channels are usually set two Average True Range (ATR) values above and below the Middle Line, which is usually set to 20-period EMA. The Keltner Channel is used to signal possible price breakouts and provide overbought and oversold readings.
The indicator is similar to Bollinger Bands (BB). But instead of using the Standard Deviation (SD) to set the distance of the bands from the moving average, Keltner Channels use the Average True Range (ATR.
The Keltner Channels (KC) indicator is categorized as an envelope, similar to Bollinger Bands(BB) and Moving Average Envelopes (MAE).
Envelopes are technical indicators that are typically plotted over a price chart with upper and lower bounds.
The basic idea behind the Keltner Channels indicator was introduced by Chester Keltner in his 1960 book, How to Make Money in Commodities.
His ideas have been expanded upon and simplified by Market Wizard and hedge fund trader, Linda Bradford Raschke. Raschke popularized the use of an exponential moving average (EMA for the Middle Line and using Average True Range (ATR) for the Upper and Lower Envelopes.
Working Principal
Keltner Channel consists of three components:
- Middle Line
- Upper Envelope (above the Middle Line)
- Lower Envelope (below the Middle Line)
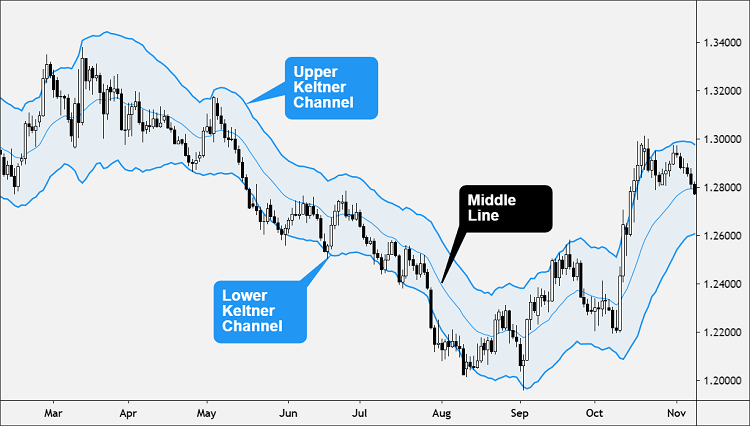
The Middle Line is a moving average of price over a specific time period, usually set to 20.
By default, an exponential moving average (EMA) is used but some traders prefer to use the simple moving average (SMA).
The distances of Upper and Lower Envelopes from the Middle Line are based on a specific multiple of the Average True Range.
All three lines move with the price, creating a channel-like appearance.
This is why the Upper and Lower Envelopes are also called “channels”.
A 20-period exponential moving average (20-period EMA) of the price used to construct the Middle Line.
Then the Average True Range is calculated over a time period (which is the same as the Middle Line) and multiplied by a multiple (usually 2).
The calculated number is then added to the Middle Line to form the upper Keltner Channel and subtracted from the midline to form the lower Keltner Channel.
The EMA determines trend direction and the ATR-multiple determines the channel width.
How to Use
Keltner originally used the Keltner Channels as a trend-following indicator, to identify the underlying trend but nowadays, are also used to identify overbought and oversold levels.
In order to know how to use the Keltner Channel indicator, you first have to identify whether the price is trending or ranging.
This determines which strategy to use:
| Trending | Ranging |
| Breakout Strategy | Overbought and Oversold Strategy |
| Trend Pullback Strategy |
Breakout Strategy
This strategy is used when the price breaks outside of the Keltner Channel.
Technical indicators based on envelopes are designed to surround most price action.
This means that any time prices move above or below the channels, you should pay attention because such occurrences are relatively rare.
Trends often start with strong moves in one direction to another.
A surge above the upper channel shows significant strength, while a plunge below the lower channel shows significant weakness.
Such strong moves can signal the end of one trend and the beginning of another.
The Breakout Strategy is used to exploit the transition from range-bound, trendless markets to uptrends or downtrends.
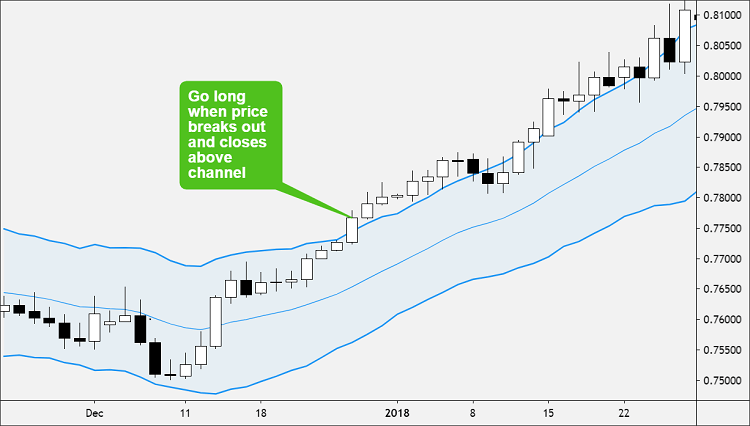
Buy Signal
- When price breaks out and closes above the upper channel, go long.
- The Middle Line is used as the exit.
- There is no profit target for this trade.
- Whether the trade has a gain or loss, simply exit the trade whenever the Middle Line is touched.
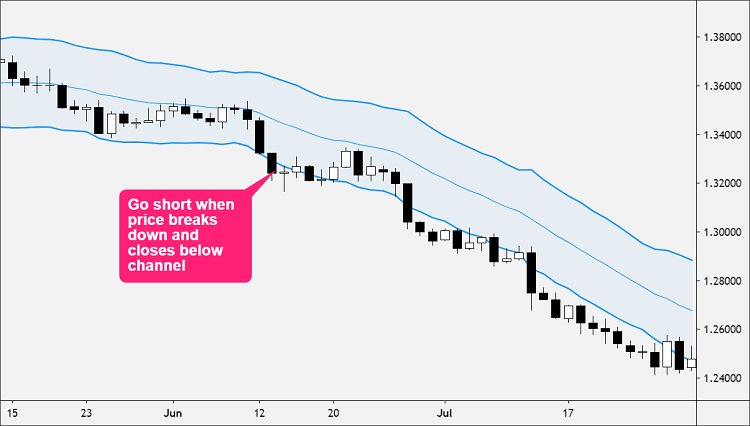
Sell Signal
- When price breaks down and closes below the upper channel, go short.
- The Middle Line is used as the exit.
- There is no profit target for this trade.
- Whether the trade has a gain or loss, simply exit the trade whenever the Middle Line is touched.
Trend Pullback Strategy
This strategy is used when the price is in a strong trend, but rather than chase it, you wait for temporary price weakness to jump back on a trend.
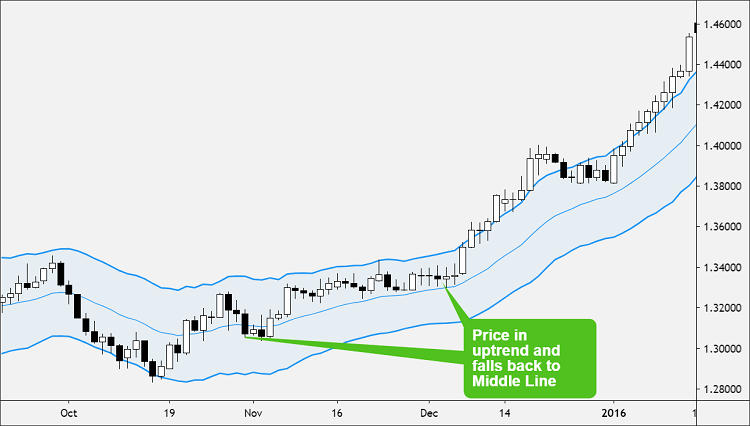
Buy Signal
- Confirm that the price remains in a strong uptrend.
- When the price pulls back to the Middle Line, go long.
- Place a stop loss about halfway between the Middle Line and lower channel. Place a profit target at or near the upper channel.
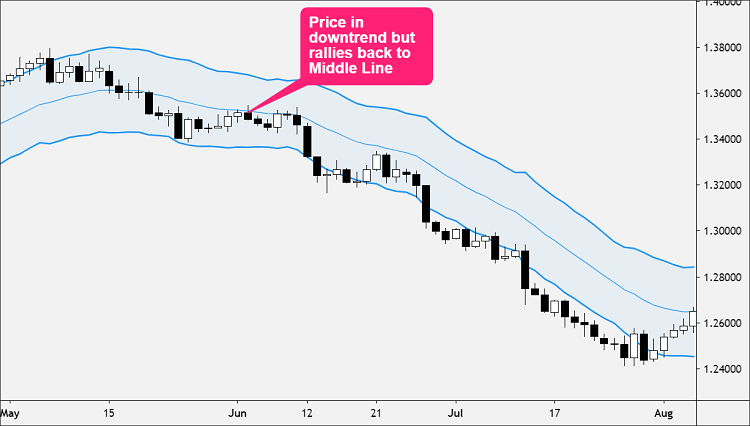
Sell Signal
- Confirm that the price remains in a strong downtrend.
- When the price rallies back to the Middle Line, go short.
- Place a stop loss about halfway between the Middle Line and upper channel.
- Place a profit target at or near the lower channel.
Before using this strategy, make sure the price is in an uptrend or downtrend.
If the price is bouncing around between the upper and lower channels, don’t use this strategy. When a clear trend is NOT present, this strategy sucks.
Overbought and Oversold
During those trendless market conditions, trading breakouts suck.
Trendless price action can be identified with a flat (horizontally sloped) moving average and the Average Directional Index (ADX).
If the price is trendless, trading in a range or sideways, you can use the Keltner Channels like an oscillator indicator and identify overbought and oversold levels.
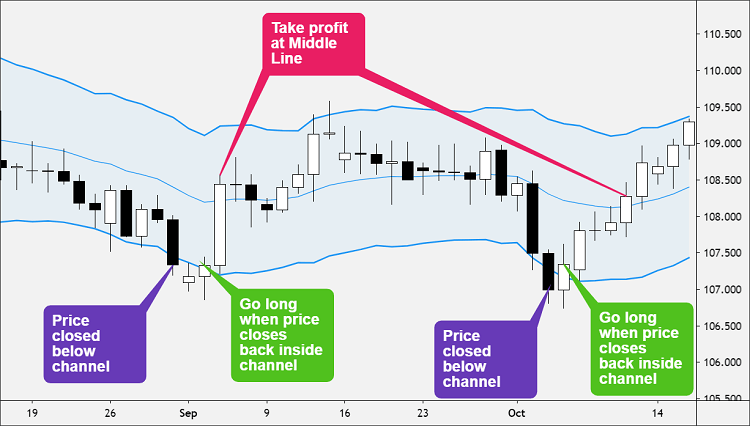
Buy Signal
- Wait for price to breakout below the lower Keltner Channel,
- Wait until the price closes back inside the lower Keltner Channel.
- Go long.
- By waiting for a close back inside the Keltner Channel, you avoid getting killed and catching a falling knife if the breakout turns out to be a true Keltner Channel downside breakout.
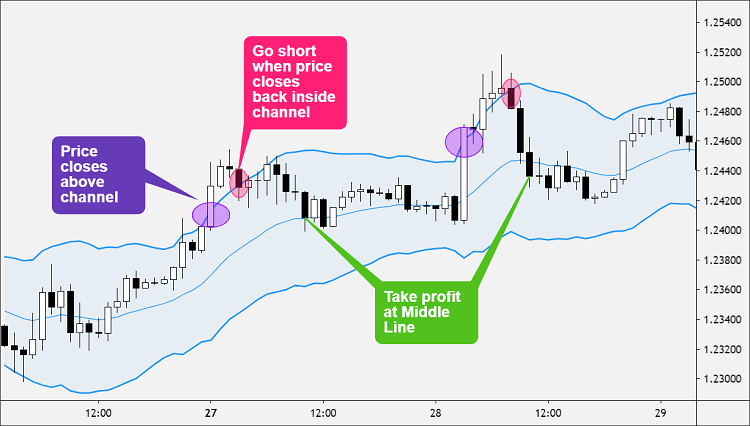
Keltner Channel Overbought Potential Sell Signal
- Wait for price to breakout above the upper Keltner Channel,
- Wait until the price closes back inside the lower Keltner Channel.
- Go short.
- By waiting for a close back inside the Keltner Channel, you avoid a bear trap if the breakout turns out to be a true Keltner Channel upside breakout.
When using Keltner Channels as an “overbought/oversold indicator”, keep in mind that overbought and oversold conditions are usually a sign of trend strength.
“Overbought” could mean a strong uptrend, while “oversold” could mean a strong downtrend.
The current trend could continue to strengthen and remain “overbought” or “oversold”.
This is why you must make sure that you only use this strategy when the price is trading sideways or ranging.
Calculation
While the Keltner Channels were introduced by Chester Keltner back in the 1960s, the indicator was updated by Linda Bradford Raschke in the 1980s.
Raschke‘s version of the indicator is what’s used today.
Keltner Channels are a combination of two other indicators:
- Exponential Moving Average (EMA)
- Average True Range (ATR)
The moving average is the average price for a certain number of periods. The EMA gives greater weight to more recent prices.
The ATR is a measure of volatility.
Keltner Channels require three parameters:
- Select a length for the exponential moving average (EMA).
- Choose the time periods for the Average True Range (ATR).
- Choose the multiplier for the Average True Range (ATR).
Here is how Keltner Channels are calculated:
Upper Band = EMA + (ATR x multiplier)

Middle Band = EMA

Lower Band = EMA - (ATR x multiplier)
You may need to adjust your Keltner Channel parameters slightly if you trade different assets.
The parameters you use on one asset may not necessarily work well for another asset.
The EMA period is commonly set to 20 but can be set to anything you want. An EMA length of 15 to 40 is typical.
A common multiplier for the ATR is 2, meaning the upper band will be plotted 2 x ATR above the EMA, and the lower band will be plotted 2 x ATR below the EMA.
When adjusting the multiplier, the higher the multiplier, the wider the channel. The smaller the multiplier., the narrower the channel.
A smaller multiplier like 1.5 or a higher multiplier like 2.5 might provide you with better information for the asset that you’re trading.
If you liked this article, then please subscribe to our Newsletter Services for Forex Related updates. You can also find us on Facebook and can subscribe to our YouTube channel. You can also join our Telegram Channel for real-time trading analysis and discussion. Here is our service sitemap. If you have any confusion please leave your comments below.


