

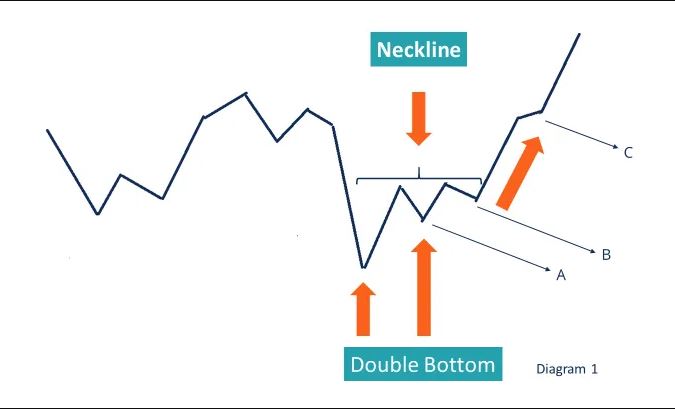
A Double Bottom is a chart pattern where the price holds a low two times and fails to break down lower during the second attempt, and instead continues higher.
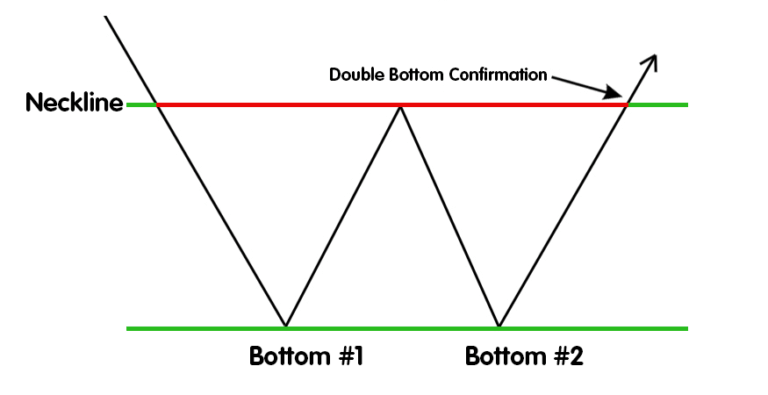
The pattern is characterized by a distinct drop in price, followed by a slight reversal (or bounce) with a second drop occurring soon after to either the same or similar level as the first before another, significant reversal so that the chart appears to take on the form of the letter “W“.
The Double Bottom reflects very strong levels of support and often indicates a strong change of trend.
Double Bottoms appear in a downtrend and reverse it to the upside as the price breaks through the resistance line.
It is considered a bullish reversal chart pattern since the price holds a low two times and eventually continues with a higher high.
The bounce between the two lows should be moderate.
The pattern is confirmed once the price reaches a higher high than the top of the bounce between the two lows.
When that resistance level is broken, it confirms a bullish trend reversal.
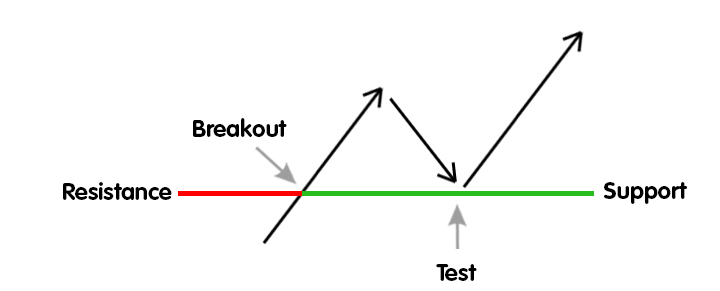
Premature breakouts can be a problem in Double Bottoms as they occur frequently, depending on the bottom shape.
The Double Bottom, along with its alter ego, the Double Top, is easily one of the most recognizable chart patterns.


