

A descending triangle is a bearish chart pattern that is used in a downtrend market and is formed by a series of lower highs and a lower resistance level.
The descending triangle is formed from two trendlines, one for high prices and one for lows.
The upper trendline of the triangle is a descending trendline, while the lower trendline is a horizontal trendline.
The resulting shape is a right triangle whose hypotenuse moves downward over time.
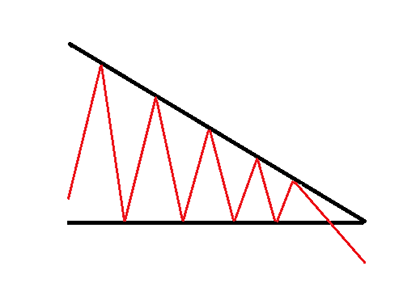
As price declines, it keeps finding resistance at a certain level and recovering some of its losses.
The subsequent retracement is shorter than previous retracements and this creates a series of lower highs.
The lower highs indicate more sellers are gradually entering the market as they are willing to accept a lower price in order to establish a short position.
This creates selling pressure as price consolidates moving towards the apex.
Prices on the upper trendline continue to decline, narrowing the triangle formation, until the level of support represented by the lower trendline is broken.
Since price is consolidating with a bearish bias, traders need to watch out for impending breakout down through the support level.
When the level of support is broken, it becomes a level of resistance, confirming the overall downward trend of the asset’s price over time.
Such a breakout can occur based on technical analysis and/or be caused by news flow so it is worthwhile to also consider the relevant fundamentals and market sentiment when using this pattern.
In order to confirm a descending triangle on an asset’s chart, traders must look for two reaction lows of similar magnitude and two reaction highs, each declining in price over time.
There should be a reasonable amount of distance between each low or high.
A descending triangle is generally considered a bearish continuation pattern. However, it can be occasionally observed in uptrends, in which case a major trend reversal might be expected.
In terms of breakouts, this pattern is also somewhat ambivalent as the escape from the Descending Triangle can happen in both directions.
Statistically, downward breakouts are more likely to occur, but upward ones seem to be more reliable.
Among the upward breakouts, the most desirable to find are those that happen after a gap. Larger gaps seem to leave less chance for the price to retreat back into the triangle.
If you liked this article, then please subscribe to our Newsletter Services for Forex Related updates. You can also find us on Facebook and can subscribe to our YouTube channel. You can also join our Telegram Channel for real-time trading analysis and discussion. Here is our service sitemap. If you have any confusion please leave your comments below.


