


We are always trying to teach you some good and standard trading strategies about the Forex market. In today’s article, we will discuss strategies for trading. Hopefully this strategy will work for you. Today we will talk about Moving Average Crossover.
For whom is the strategy?
Moving Average trade setup This technique will work best if you are a Day Trader, Swing Trader or Position Trader. This is also effective for those who prefer scalping, but scalping is not available because of short time trade and good trade signal in short time. Therefore, those who use this technique for scalping must have practiced it well in advance.
If you do not know what kind of trader you are, please take a look at our “Trader’s Type” article.
Chart setup
Moving Average trade setup This strategy is made by Moving Average, a popular indicator. We have already talked about different types of moving averages. If you still want to know more about Moving Average Indicators, see our Indicators section.
Now you will set this Moving Average Indicator within your trading platform.
In this strategy, we will work with three different moving averages. In this case we have selected Exponential Moving Average. Here we will set the values of three separate moving averages and add them to our chart, whose values are, respectively –
Moving Average (EMA) – 1 (Blue Line)
Moving Average (EMA) – 1 (Yellow Line)
Moving Average (EMA) – 25 (Red Line).
How to add moving average to your chart?
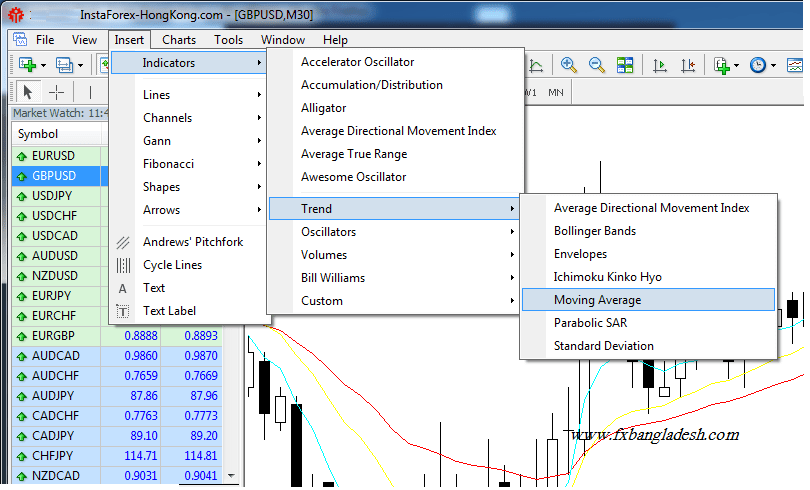
First you have to go to the trading platform you are using. Here MT4 or MT5 are the same. From there, select your preferred currency pair and open a chart. After the chart is open, click on Insert -> Indicator -> Trend -> Moving Average, at the very top of your trading platform. For your convenience, we’ve tried to use the image below –
You can set the moving average in your chart like the image above. After you click on the Moving Average button, a box similar to the image below will appear. Here we will set the value of this indicator. Notice that we will only work with Exponential moving average here.
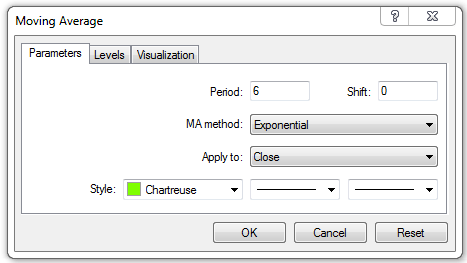
Add 6 to the Period cell and select the Exponential in the cell of the MA method. Now you can choose the color you want so that you can understand the color on the chart by understanding it is the moving average of 6 period.
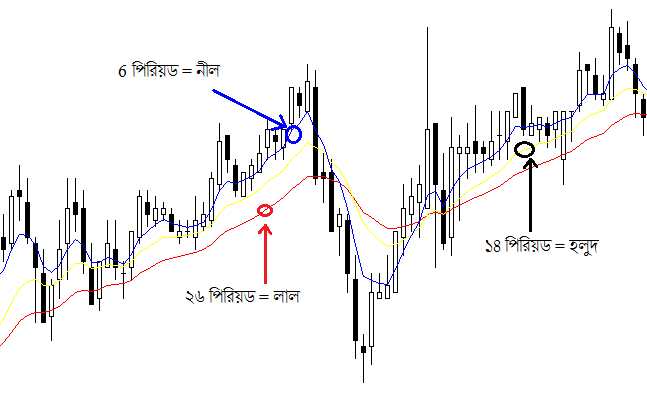
In the same way, you will set the moving average separately color selection array by separating the 14 and 26 period.
We facilitate your understanding,
- Color of the moving average of the period – Blue,
- The color of the moving average of the period – yellow and
- I chose the color of the moving average of the period – red. However, you can choose the color you want.
Once the 4 moving averages have been set, you will see three separate moving averages on your chart.
Trading strategies
We have tried to show some of the techniques used in a 30mnt chart of GBP / USD currency pair here.
How to get Buy Signal?
Since we will be dealing with three different moving averages, it is important to first be aware of some of these behaviors. Moving average of 5 periods will move the market price movement first. Then move the 1 moving period of the period and finally move the period of the period 25.
When you see the blue line crossing the yellow and red lines from bottom to top, you should understand that it is giving you a Buy Signal. Notice the image below –
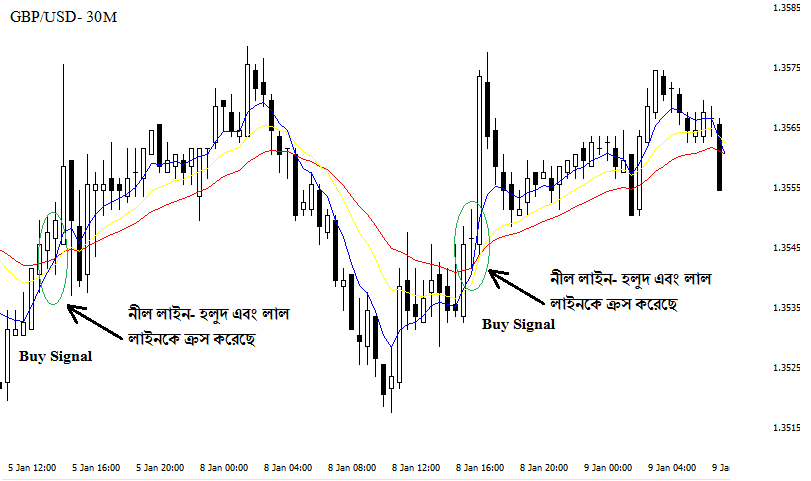
Look a little better on the chart, we will get a bye signal when the blue line crosses the other two color lines from bottom to top.
As you already know, the first to move with the market price is the blue line, then the yellow line and finally the red line. Take a good look at the figure above.
One thing to keep in mind in the Moving Average trade setup,
During the BUY signal, there will be blue, then yellow, and finally red lines.
How to get a sell signal?
Since we will be dealing with three different moving averages, it is important to first be aware of some of these behaviors. Moving average of 5 periods will move the market price movement first. Then move the 1 moving period of the period and finally move the period of the period of the period 25.
When you see the blue line, yellow and red line crossing from top to bottom, you will realize that it is giving you a Sell Signal. Notice the image below –
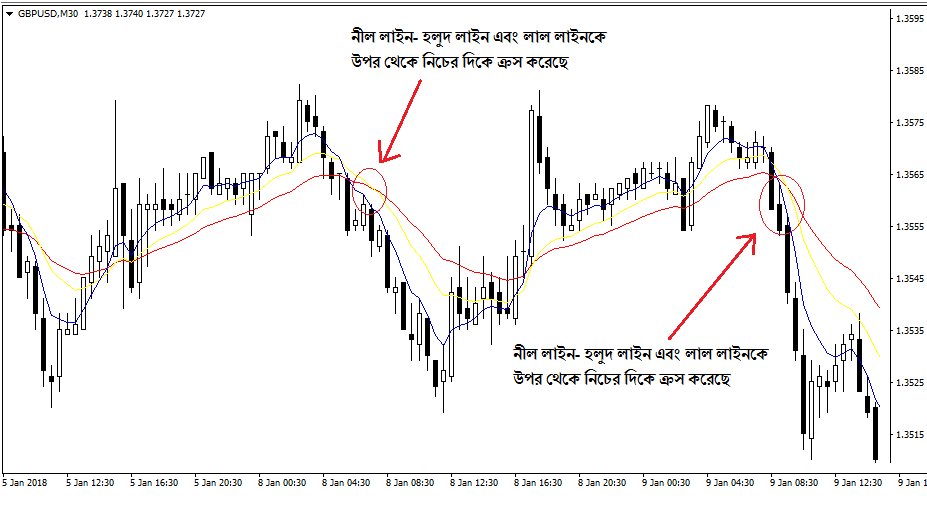
Look at the chart a little better, we will get a cell signal when the blue line crosses the other two color lines from top to bottom.
As you already know, the first to move with the market price is the blue line, then the yellow line and finally the red line. Take a good look at the figure above.
One thing to keep in mind in the Moving Average trade setup,
During the sell signal, all will be blue, then yellow and finally the red line.
What a pair and timeframe for this strategy!
Currency pairing – We always advise you to trade only on the major currency pair and if you are a new trader, you will only trade in the major currency pair. The main reason for this is that the spread of common currency pairs is usually very low. So you do not trade in any pair, you get profit if you spread less.
We recommend, EUR / USD, GBP / USD, USD / CAD, USD / JPY, NZD / USD, you can get good signal on these currency pairs.
Timeframe selection – You can use this strategy to trade in any timeframe you choose. However, we recommend that a timeframe of at least 30mnt be used for this strategy.
One thing to keep in mind, the shorter the trading timeframe the trading signal becomes, the more difficult you are to trade. It does not take long for the short-term price movement to change. On the other hand, if you use this technique in a slightly larger timeframe, you will get stronger and better signals. Remember, a trend formed in a large timeframe is just as time-consuming as a trend.
Risk Warning: Before using any of our published strategies, in real trade, you must practice and understand the details of this signal. You must be accustomed to it before using any new techniques in your trade. Never trade passionately or in a hurry based on a trading strategy. This topic is risky so if you have any knowledge of this strategy please contact us.
If you liked this article, then please subscribe to our Newsletter Services for Forex Related updates. You can also find us on Facebook and can subscribe to our YouTube channel. You can also join our Telegram Channel for real-time trading analysis and discussion. Here is our service sitemap. If you have any confusion please leave your comments below.


