


FXBangladesh.com – We always get the urge from you to publish articles about different types of trading strategies but the interesting thing is, there is really no theoretical strategy for Forex trading. Each trader uses different types of indicators, chart patterns and technical tools to create his own trading strategies. So, there is no reason to think this way of using a trading strategy that will work well for you. To help you out, we have already discussed a number of different trading strategies and also presented to you how you can bring profit from the trade using these techniques. Accordingly, in today’s article we will introduce you to another new trading strategy and try to inform you on how to trade profitable using this 100 Moving Average. So let’s get started.
– Video Tutorial –
If you like the video below you can get some good ideas as to how to use this trading strategy in the trade. We have tried to show you the details of this through video tutorial.
100 Moving Average Strategy for whom?
100 Moving Average This technique will work best if you are a Day Trader, Swing Trader or Position Trader. For those who like scalping, it is very likely that they will not get a special signal. Therefore, those who use this technique for scalping trading will have to practice it well before starting the real trade. If you do not know what kind of trader you are, please take a look at our “Trader’s Type” article.
100 Moving Average Chart Setup
100 Moving Average This technique is composed of a popular indicator Moving Average. We have already talked about different types of moving averages. If you still want to know more about Moving Average Indicators, see our Indicators section. So let’s see how the 100 Moving Average chart is set up to start trading, not looking at it. We will work with this strategy, the only moving average. In this case we have selected Simple Moving Average. Now we will determine the value of the simple moving average and set it in the chart.
How to add moving average to your chart?
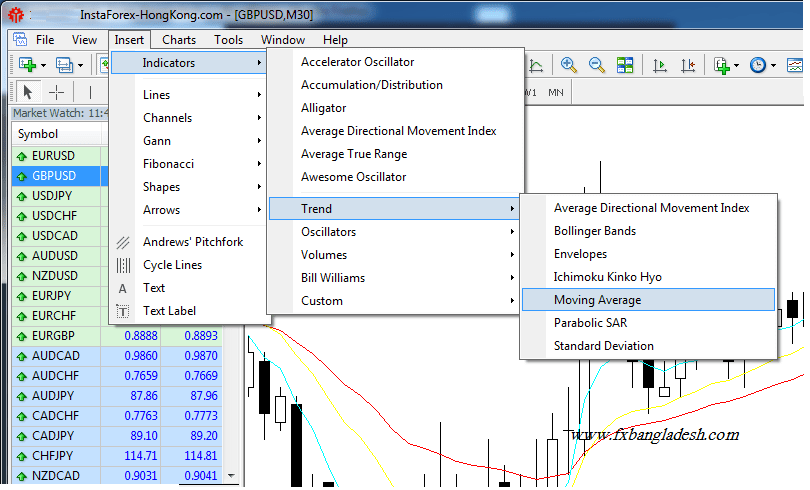
First you have to go to the trading platform you are using. Here MT4 or MT5 are the same. From there, select your preferred currency pair and open a chart. After the chart is open, click on Insert -> Indicator -> Trend -> Moving Average, at the very top of your trading platform. For your convenience, we’ve tried to use the image below –
You can set the moving average in your chart like the image above. After you click on the Moving Average button, a box similar to the image below will appear. Here we will set the value of this indicator. Notice that we will only work here with the simple moving average.
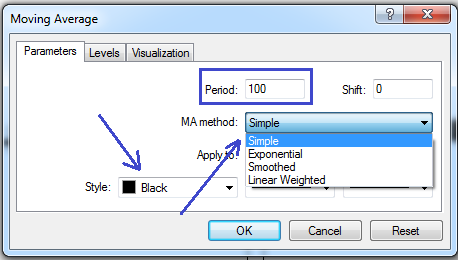
Put 100 in the Period cell and select Simple in the cell of the MA method. Now select the color according to your choice so that you can understand it by looking at the color in the chart. In the interest of presenting the strategy to you, we have selected its color “black”. That is, the black line on the chart is 100 Moving Average.
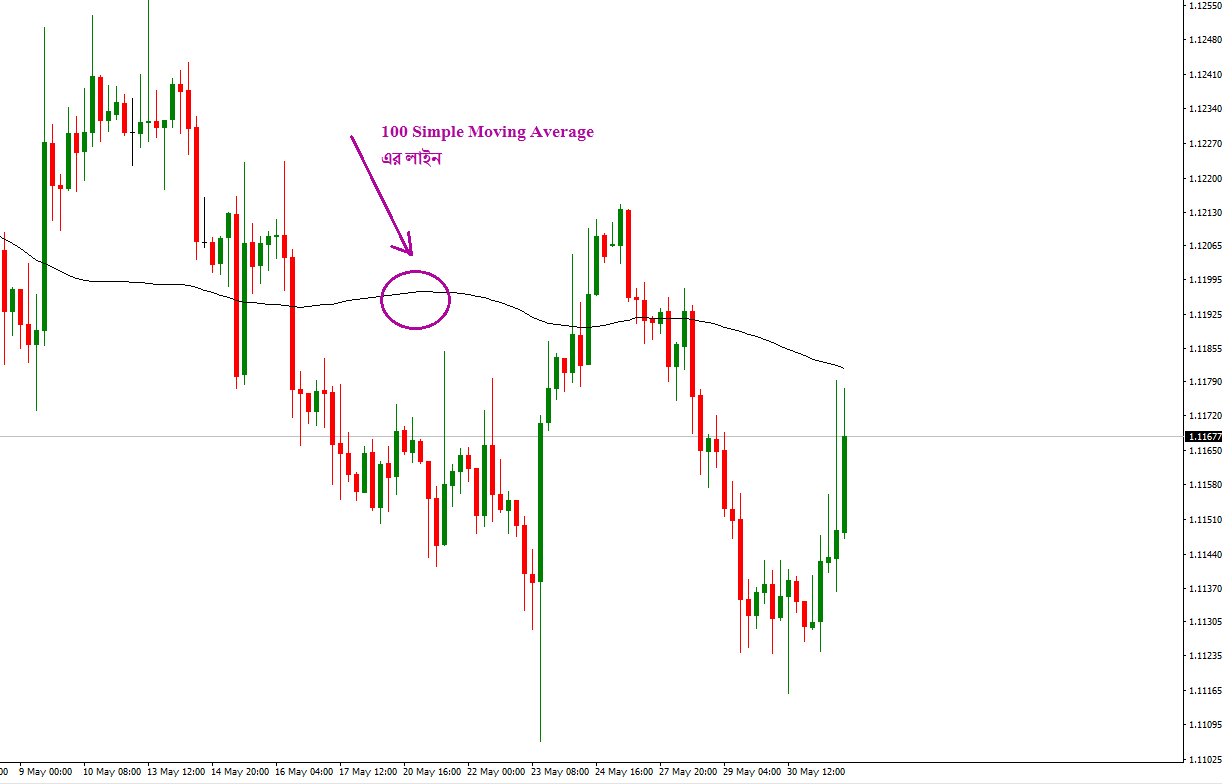
Once the moving average is set on the chart, you will see a line of moving averages in your currency pair chart. Much like the image below –
100 Moving Average Trading Strategies
We have tried to show the use of this technique here in the chart of the H4 timeframe of the EUR / USD currency pair.
How to get cell / SELL signals?
Since we only trade with a moving average, it is important to first be aware of some of these behaviors. To put it simply, if price is below the 100 Moving Average line in the chart, we can assume that the price will remain in the seltrend. Take a look at the image below –
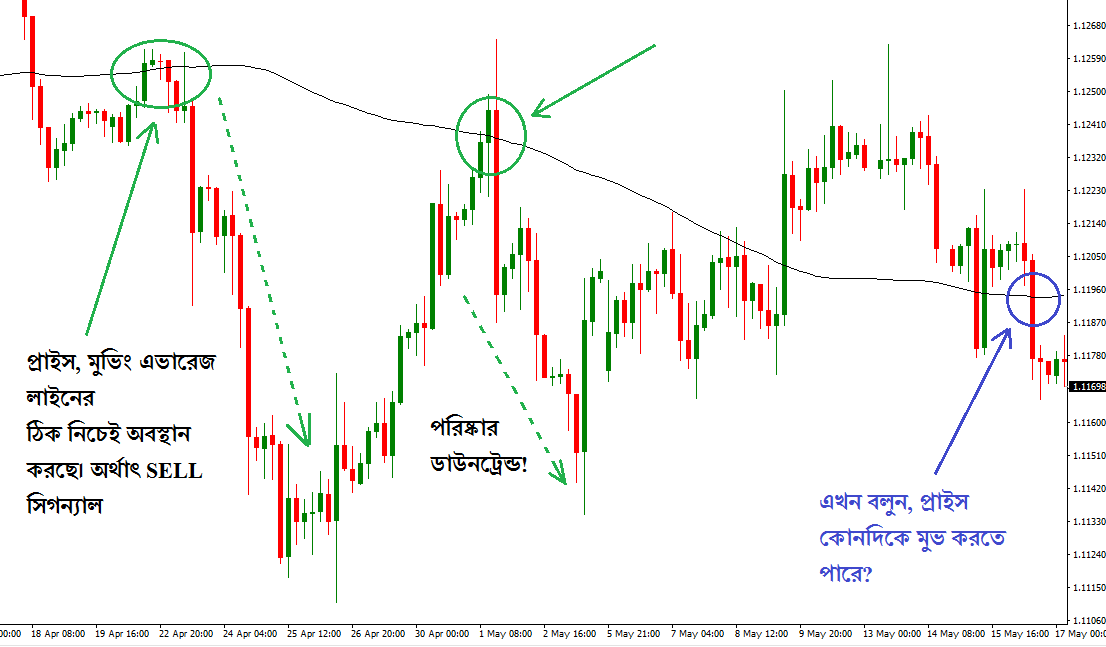
Take a good look at the chart, the price moving average is closer to the bottom line and down again. That is, according to the strategy we said that if the price is below this moving average line, then the price has to be in the celltrend. Hope you understand the whole strategy. Look at the end of the chart above, is the price still below the moving average line again? So where can Price be next? That is, take the BUY or accept the SELL entry?
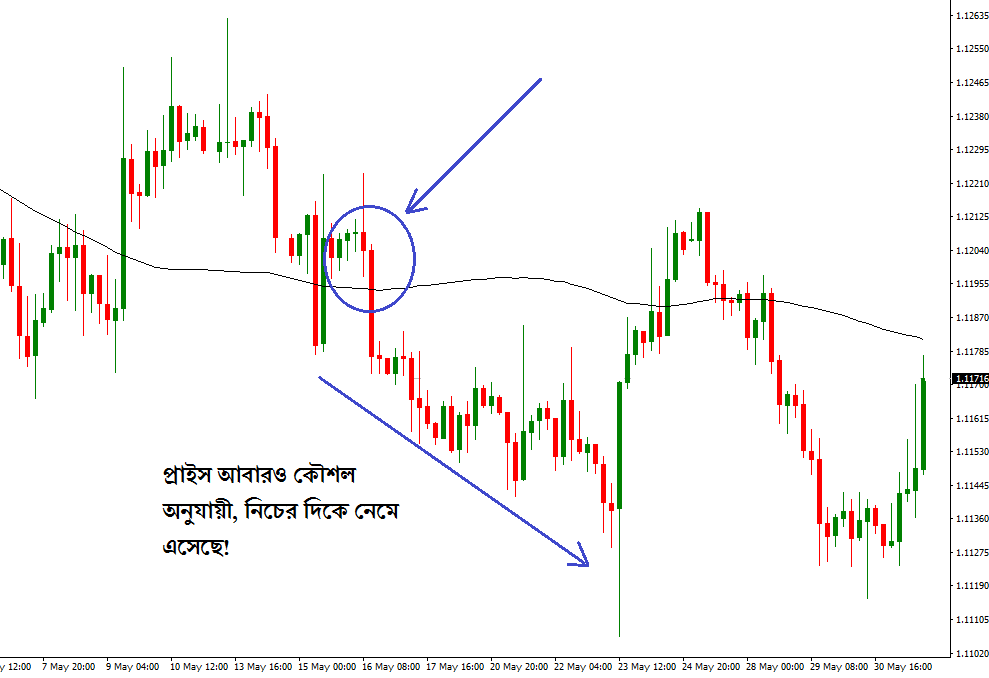
If your answer is SELL then I understand that you understand the strategy correctly. And if you are thinking of a BUY entry, brother should start consulting a good ophthalmologist soon.
How to get the BUY signal?
Since we only trade with a moving average, it is important to first be aware of some of these behaviors. To put it simply, if the price is positioned above the line of this 100 Moving Average in the chart, we can assume that the price will be in the bitrend. Notice the image below-
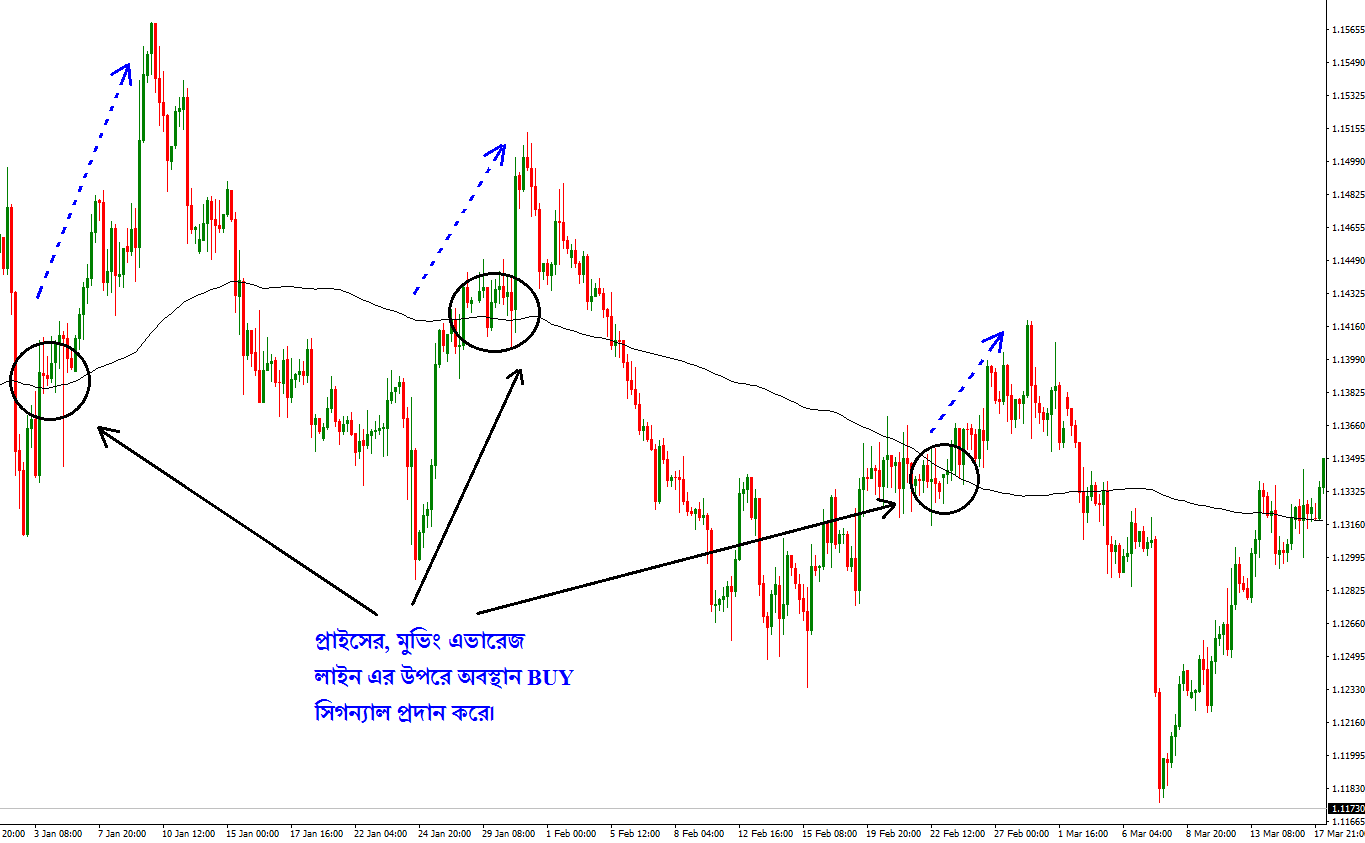
Take a good look at the chart, whenever Price is staying above the moving average line or breakout, the direction of the strong uptrend appears. That is, always keep in mind, the price of the position above the 100 Moving Average line is BUY.
#Pair and timeframe for this strategy!
Currency pairing – We always advise you to trade only on the major currency pair and if you are a new trader, we recommend that you stay on the EUR / USD currency pair only. The main reason is that in this currency pair, the spread is usually very low and the amount of movement is very tolerable. Because of this, even if any of the entries taken is wrong, you will not lose too much loss or damage.
We recommend, EUR / USD, GBP / USD, USD / CAD, USD / JPY, NZD / USD, you can get good signal on these currency pairs.
Timeframe selection – You can use this strategy to trade in any timeframe you choose. However, we suggest that the most common timeframe for this strategy is H4. Also, you can use this strategy if you want Day or Weekly timeframes.
One thing to keep in mind, the smaller the trading timeframe the trading signal becomes, the more difficult you are to trade. It does not take long for the short-term price movement to change. On the other hand, if you use this technique in a slightly larger timeframe, you will get stronger and better signals. Remember, a trend formed in a large timeframe is just as time consuming as a trend.
Risk Warning: Before using any of our published strategies, in real trade, you must practice and understand the details of this signal. You must be accustomed to it before using any new techniques in your trade. Never trade passionately or in a hurry based on a trading strategy. This topic is risky so if you have any knowledge of this strategy please contact us.
If you liked this article, then please subscribe to our Newsletter Services for Forex Related updates. You can also find us on Facebook and can subscribe to our YouTube channel. You can also join our Telegram Channel for real-time trading analysis and discussion. Here is our service sitemap. If you have any confusion please leave your comments below.


