

Similar to rectangles, pennants are continuation chart patterns formed after strong moves.
After a big upward or downward move, buyers or sellers usually pause to catch their breath before taking the pair further in the same direction.
Because of this, the price usually consolidates and forms a tiny symmetrical triangle, which is called a pennant.
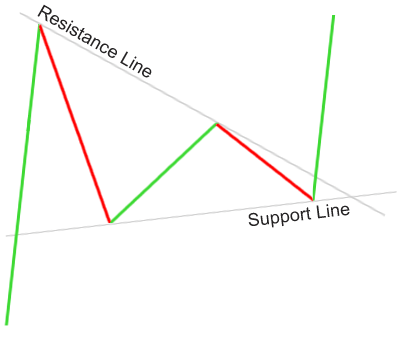
While the price is still consolidating, more buyers or sellers usually decide to jump in on the strong move, forcing the price to bust out of the pennant formation.
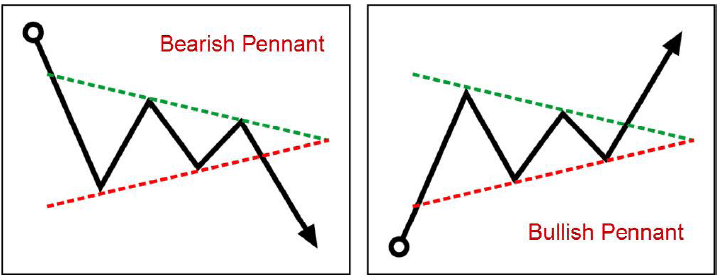
Bearish Pennants
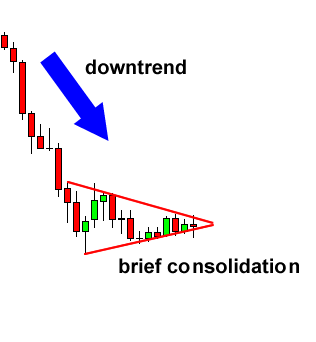
A bearish pennant is formed during a steep, almost vertical, downtrend.
After that sharp drop in price, some sellers close their positions while other sellers decide to join the trend, making the price consolidate for a bit.
As soon as enough sellers jump in, the price breaks below the bottom of the pennant and continues to move down.
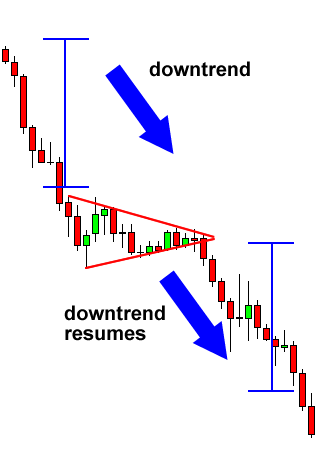
As you can see, the drop resumed after the price made a breakout to the bottom.
To trade this chart pattern, we’d put a short order at the bottom of the pennant with a stop loss above the pennant.
That way, we’d be out of the trade right away in case the breakdown was a fakeout.
Unlike the other chart patterns wherein the size of the next move is approximately the height of the formation, pennants signal much stronger moves.
Usually, the height of the earlier move (also known as the mast) is used to estimate the size of the breakout move.
Bullish Pennant
Bullish pennants, just like its name suggests, signals that bulls are about to go a-chargin’ again.
This means that the sharp climb in price would resume after that brief period of consolidation when bulls gather enough energy to take the price higher again.
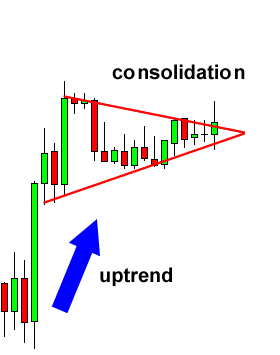
In this example, the price made a sharp vertical climb before taking a breather. I can hear the bulls stomping and revving up for another run!
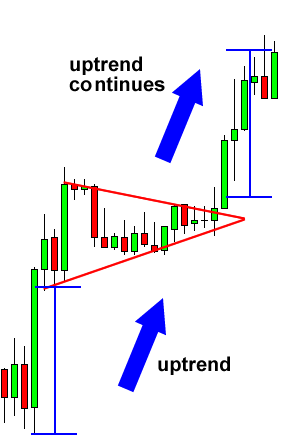
Just like we predicted, the price made another strong move upwards after the breakout.
To play this, we’d place our long order above the pennant and our stop below the bottom of the pennant to avoid fakeouts.
Like we discussed earlier, the size of the breakout move is around the height of the mast (or the size of the earlier move).
You see, pennants may be small in size but they could signal huge price moves so don’t underestimate ’em!
Pennant vs. Symmetrical Triangle
At first glance, a bullish Pennant may appear to look very much like a Symmetrical Triangle but on closer inspection, it is typically of a smaller size and duration with volume tending to contract during the pause and then increase on the breakout.
The Pennant is also not considered to be as volatile as a Symmetrical triangle.
The Pennant is often interpreted as a brief pause occurring in a strongly trending market and it is considered that the movement following the completion should duplicate the move preceding completion of the pennant.
A symmetrical triangle is a chart pattern characterized by two converging trendlines connecting a series of sequential peaks and troughs.
The two differ by the duration and the appearance of a ‘flagpole’
A bullish Pennant, one that performs on an uptrend will result in prices that break higher while a bearish pennant will result in breaking at a lower level.
If you liked this article, then please subscribe to our Newsletter Services for Forex Related updates. You can also find us on Facebook and can subscribe to our YouTube channel. You can also join our Telegram Channel for real-time trading analysis and discussion. Here is our service sitemap. If you have any confusion please leave your comments below.


