

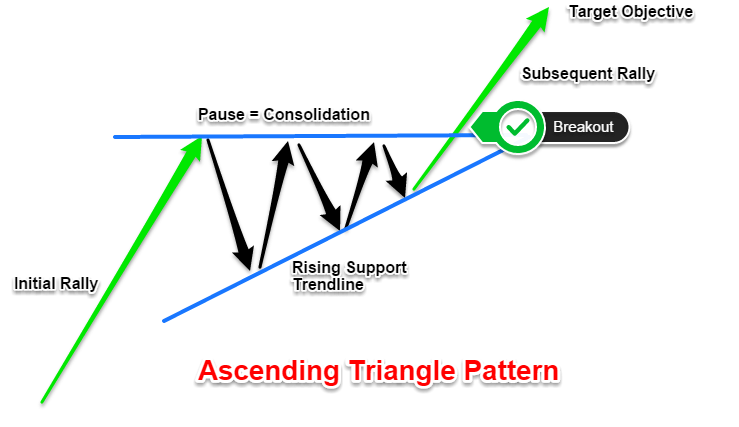
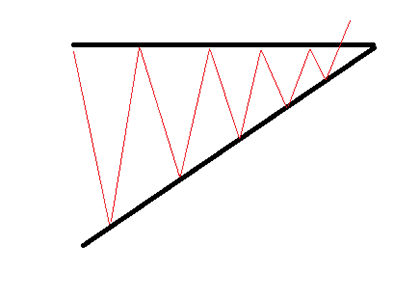
An ascending triangle is a bullish chart pattern and is formed by a series of higher lows and an upper resistance level.
It is defined by two lines:
- A horizontal resistance line running through peaks.
- An uptrend line drawn through the bottoms.
While two bottoms belonging to the same trendline would suffice for pattern recognition, it is more favorable when there are more.
As price rallies, it finds resistance and begins to erase some of its gains.
The subsequent fall in price is shorter than the previous fall and this manifests the series of higher lows.
If a line is drawn above and below the pattern, the top line will appear straight while the bottom will slope upwards at an angle.
The higher lows indicate more buyers are gradually entering the market and buying pressure increases as price consolidates moving further towards the apex.
Price is consolidating with a bullish bias so traders should watch out for an impending breakout up through the resistance level.
If price can break through the resistance level, that level will now act as a support level
The breakout can occur based on technical analysis and/or be caused by news flow so it is worthwhile to also consider the fundamentals and market sentiment when using this pattern.
Watch out for fakeouts (false breakouts) carefully as they might be easily confused with the true ones when, in fact, the price is going to retreat back into the triangle.
An ascending triangle is classified as a continuation chart pattern.
Continuation patterns are expected to lead to the continuation of an existing trend.
Continuation patterns also include symmetrical triangles, descending triangles, wedges, flags, rectangles, and pennants.
While the ascending triangle is considered a bullish continuation pattern, exceptions are quite possible. It’s not infrequent to see it develop in downtrend conditions.
If formed in the downtrend, the ascending triangle is more likely to act as a reversal pattern.
Breakouts can also happen in both directions. Statistically, upward breakouts are more likely to occur, but downward ones seem to be more reliable.
The majority of breakouts of either direction are observed in the second half of the pattern formation distance.
If you liked this article, then please subscribe to our Newsletter Services for Forex Related updates. You can also find us on Facebook and can subscribe to our YouTube channel. You can also join our Telegram Channel for real-time trading analysis and discussion. Here is our service sitemap. If you have any confusion please leave your comments below.


