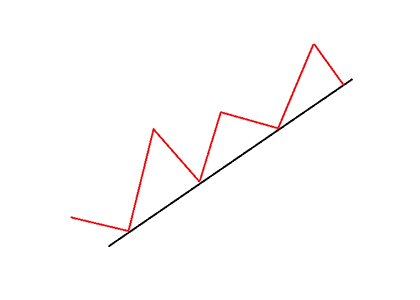
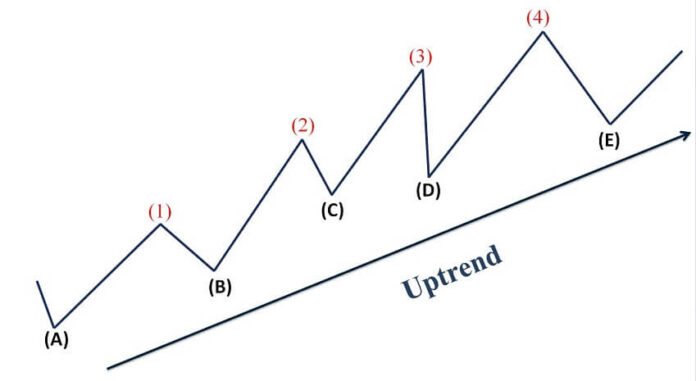
An ascending trend line is a chart pattern containing two or higher lows that can be connected with a straight line.
It is a bullish pattern created by connecting two or more lows, with each successive low higher than the previous low.
This creates an upward sloping trend line

An ascending trend line is also known as an “uptrend line“.
Since technical analysis is built on the assumption that prices trend, the use of trend lines is important for both identifying and confirming trends.
An ascending trend line acts as support and indicates that demand (more buyers than sellers) is increasing even as the price rises.
A rising price combined with increasing demand is very bullish and shows really strong buying pressure.
As long as the price action stays above this line, it is a bullish trend.
Price can bounce as the trend line acts as support.
Price usually retests a sloped trend line several times, until it breaks at which point we may have a trend reversal.
The more points there are to connect, the stronger a trend line becomes.
The strength of the trend line is also determined by how many market participants recognize the trend line.
If a lot of the market acknowledges the same trend line that you see, then the trend line becomes self-fulfilling.
As long as prices remain above the trend line, the uptrend is considered solid and intact.
A break below the ascending trend line indicates that buyer demand has weakened and a change in trend could be imminent.
If price breaks through the ascending trend line, you can short the breakdown but be aware of fakeouts (false breakouts) though.
If you liked this article, then please subscribe to our Newsletter Services for Forex Related updates. You can also find us on Facebook and can subscribe to our YouTube channel. You can also join our Telegram Channel for real-time trading analysis and discussion. Here is our service sitemap. If you have any confusion please leave your comments below.


