


Many of us ask every day, brother, what is the best indicator? In fact, we never advise anyone on the use of a particular indicator. Because we know that if you start trading based on an indicator, your future will be like a “charlatan“. So now you may have questions, are all indicators bad? No! “Indicators are bad” but we never said that. We just said, to trade without being dependent on the indicator.
The MetaTrader platform (MT4/MT5) is automatically provided with a variety of indicators, of which we will introduce you today to the popular Ichimoku Indicator. We have discussed with you some of the more popular indicators before and have told you about their different functions. Click on the Indicators section of our website to learn about different types of indicators. We traded real-time individually using different types of indicators but the best profitable entry from them was from this Ichimoku Indicator. Did you worry? Don’t worry! After using these different indicators, a detail Research article has been published explaining the results of our trade. If you want, our Best Indicator can check out this article.
If you would like to know more about this Ichimoku Indicator via our published video. Please click through to this video and watch the entire tutorial carefully.
– Video Tutorial –
Below, we have also tried in the article form to give you detailed information about this indicator. You can read it carefully. Let’s start now –
Ichimoku Indicator – This is a Japanese indicator which means,
Ichimoku = at a glance
Kinko = equilibrium state
Hyo = chart
If we say together, it means.. . . .
Ichimoku Kinko Hyo = Equilibrium state of the chart at a glance.
Ichimoku Indicator alike other popular indicators such as MACD, RSI, Moving Average, Stochastic, is also very popular and widely used by Forex traders. It will be a blessing to your Forex trade even if it is a little difficult to understand. So let’s get started.
We hope you didn’t understand anything.
There is nothing to despair about. We will explain everything to you clearly. Of the types of indicators for trading on Forex, the Ichimoku Indicator is the oldest.
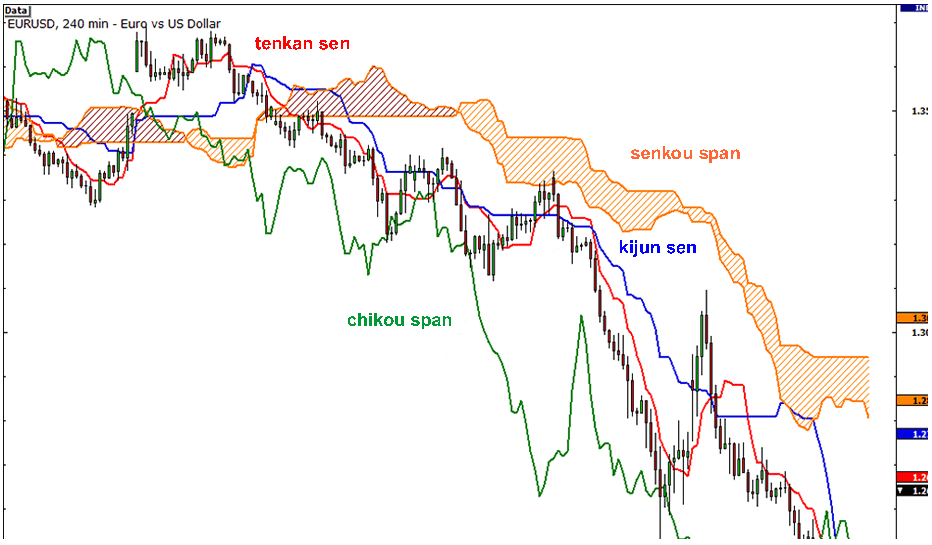
A Japanese journalist first created it around the 1930s and released it for use in 1968. That means he tested it for a long period of 38 years and then released it for everyone to use. Ichimoku Kinko Hyo is for those who can understand the charts and the status of the market at a glance. If you see in the chart above, some lines are drawn. We will now know the details of it.
Kijun Sen (blue line): This is called the Standard line or the Base line. This is calculated by averaging the highest high and the lowest low for the last 26 periods.
Tenkan Sen (red line): This is also known as the Turning line and is derived by averaging the highest high and the lowest low for the past nine periods.
Chikou Span (green line): This is called the Lagging line. It is today’s closing price plotted 26 periods behind.
Senkou Span (orange lines): The first Senkou line is calculated by averaging the Tenkan Sen and the Kijun Sen and plotted 26 periods ahead.
The second Senkou line is determined by averaging the highest high and the lowest low for the last 52 periods and plotted 26 periods ahead.
Hope you understand. You don’t have to remember the names of any lines, What’s more, important is for you to know how to interpret these fancy lines.
How to Trade with Ichimoku Indicator?
Now look at the chart below,
If you see that the market price is above the Senkou span line then the 1st Senkou Line will serve as the 1st Support and 2nd Senkou Line 2nd Support Level.
And if you see that the market price is below the Senkou span, then the 2nd Senkou Line will serve as the 1st Resistance and the 8th Senkou Line 2nd Resistance.
Got it? If you can’t, read it again and try to understand it better.
Meanwhile, Kijun Sen (blue line) will serve as an indicator of the future price movement. If the market price is above Kijun, the market price can go up further. And if the market price is below Kijun, then the market price can go down further.
The Tenkan Sen (red line) serves as a guide for market trends. If you see the red line going down and down, then you will know that there is a market movement. And if you see that the red line is horizontal, then you have to understand that the market is rotating within a certain price range.
Chikou Span (green line), if you see that the green line has crossed the market price from bottom to top (bottom-up direction) then you have to understand that it has given you buy signal. And if you see that the green line crosses the market price from top to bottom, then you will realize that it has given you a sell signal.
Take a look at this chart. In this, we have tried to give you an idea of how Ichimoku Indicator signals.
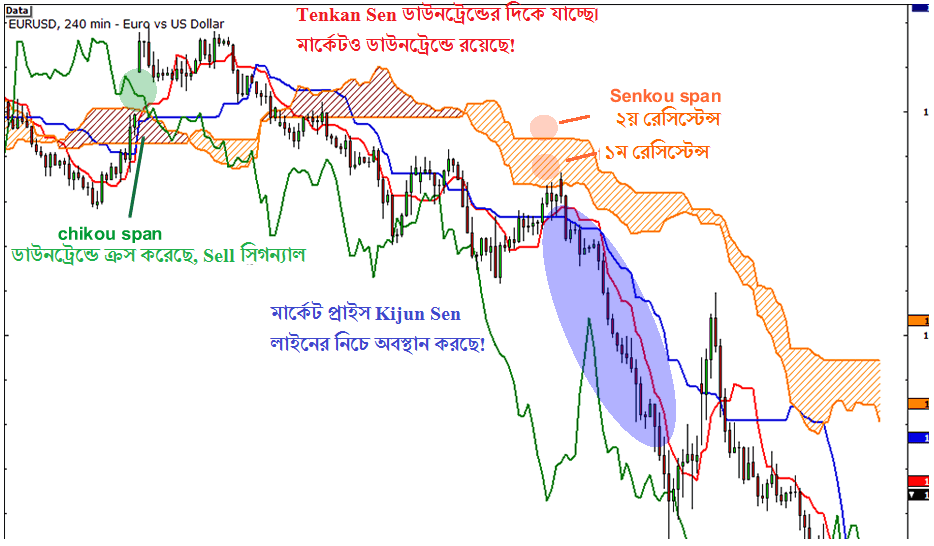
We know you have trouble understanding this indicator but it is an indicator that shows you support, resistance, market trend, market crossover together. That means you can know everything if you use an indicator.
We would urge you to try to understand this very well. This will help a lot in your future trading activities. If you do not understand anything, read it a few times well, and if you still have a problem then contact us at Live Support. We will try our best to assist you.
If you liked this article, then please subscribe to our Newsletter Services for Forex Related updates. You can also find us on Facebook and can subscribe to our YouTube channel. You can also join our Telegram Channel for real-time trading analysis and discussion. Here is our service sitemap. If you have any confusion please leave your comments below.


