


This is one of the most popular indicators for Forex traders. Created by John Bollinger, it is used primarily to understand the movement of the market. In a word, it will tell you whether the market movement is now high or low or to be more specific it measures the market’s volatility.
It means this technical tool tells us whether the market is quiet or a storm is coming!
When the bands are close to each other, the movement of the market is low and when the market is moving, the bands become wide.
If you would like to see a video tutorial on this indicator, please click on the video below.
– Video Tutorial –
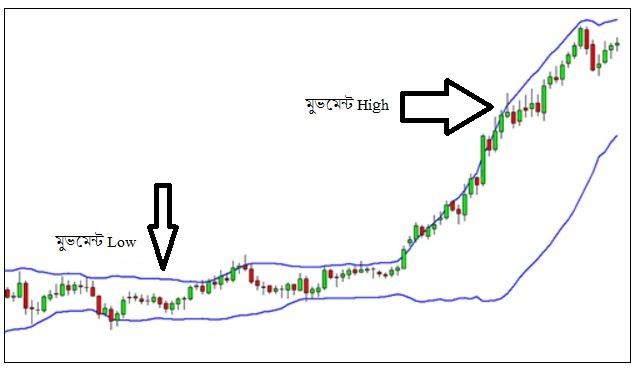 Notice in the chart above, when the movement was low in the market, the bands were very close to each other, and when the movement was higher in the market, the bands went far. Basically this is one of the main tasks of Bollinger Bands.
Its calculation, mathematical formulas and other things behind it, but we didn’t fell typing it all out. Actually, you do not need to learn about these in detail. We think, rather getting information about the structure of the bands and its mathematics, it is even more important to know how to apply Bollinger Bands in your real trading. If you would like to know more about Bollinger Bands, you can purchase Bollinger on Bollinger Bands book written by John himself.
The Bollinger Bounce
one thing you should know about Bollinger Bands is that price tends to return to the middle of the bands. That is the whole idea behind the “Bollinger Bounce.”
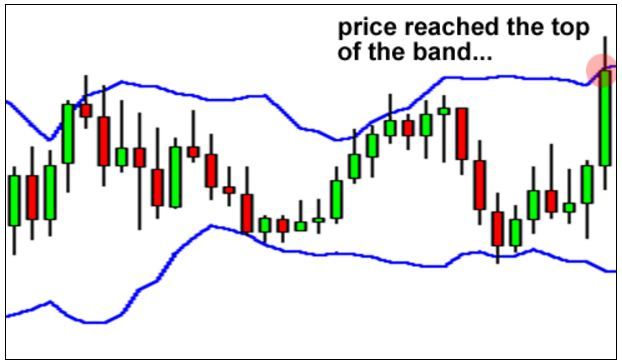 Looking at the chart above, can you tell us where the market price can go now?
If your answer is down, it means you will go to Sell position then you are absolutely right. Now notice the chart below,
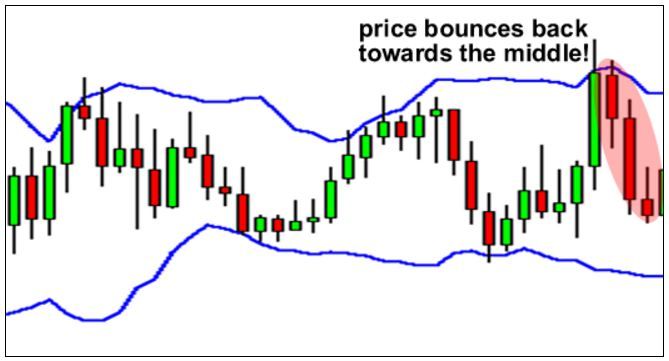 What you are seeing now is the Perfect Bollinger Bounce. Now the question is, why did this happen? The answer is simple, Bollinger Bands serves as the dynamic support and resistance of the market.
The larger the time frame you use the band signal, the stronger it becomes.
The best time to use is when the movement of the market is very low. That means when the price moves around a certain range of levels.
Bollinger Squeeze
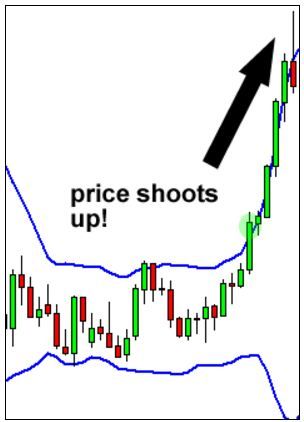
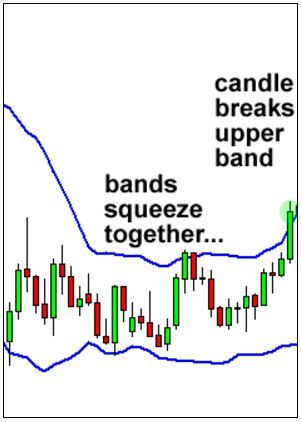 When you see the bands pushing towards each other usually means, the market will be ready to breakout.
If a Candle breaks the upper band, that means it will go higher. And if a Candle breaks the lower band, that means the price will go down further.
Take a look at this chart, the bands squeeze together and the price has broken the upper band.
Now tell us, where the market price can go?
If your answer is Buy then assume that you understand the indicator pretty well. Now notice the chart below.
This is how Bollinger Squeeze works. This strategy is designed to help you capture the movement of the market in advance. This kind of signal is not always available. You may get 2-4 times a week if you trade on the chart for 15 minutes.
Also, you can do more with Bollinger Bands, but these two techniques outlined above are the most popular and the most commonly used. We hope you understand this indicator.
We suggest you try out the techniques in the demo trade before using them in real, so you can catch them more easily.
If you liked this article, then please subscribe to our Newsletter Services for Forex Related updates. You can also find us on Facebook and can subscribe to our YouTube channel. You can also join our Telegram Channel for real-time trading analysis and discussion. Here is our service sitemap. If you have any confusion please leave your comments below.


