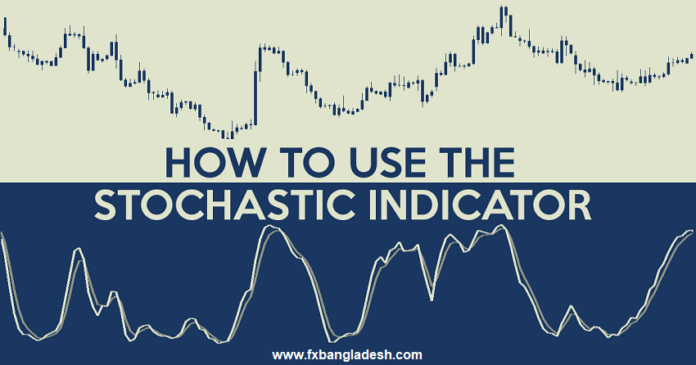
Stochastic oscillator
Stochastic oscillator is one of the forex chart analysis indicators that gives you a sense of where the market trends may end up. For your benefit, we have published the content through video tutorial. For those who want to watch the tutorial, please click on the video button below.
– Video Tutorial –
Stochastic is an oscillator that helps you understand whether the market is Overbought or Oversold. Like the MACD, this indicator is made up of two lines and one line is much faster than the other.
How to use Stochastic Indicator?
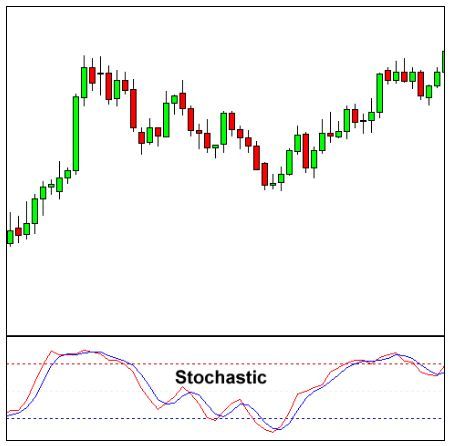
As I said earlier, Stochastic gives us the idea of market overbought or oversold. It has a specific measuring scale with values ranging from 0-100.
এই চার্ট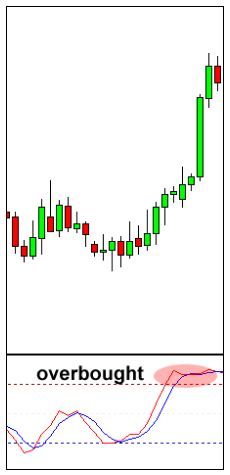 টি ভালো করে লক্ষ্য করুন।
When the Stochastic lines are above 80 (red points), that means the market is now Overbought and when the Stochastic lines are below 20 (the blue points), the market is now Oversold.
According to the golden rules,
We will buy when the market is Oversold and we will sell when the market is Overbought.
Look at this currency chart, you will see the indicator showing you that the market has been in Overbought condition for a while. According to the rules, where can the price go now?
If your answer is Sell then you have passed the exam. Now notice the chart below, the market has been in overbought position for a while and the market has been forced down.
 This is the basic instruction of the Stochastic Indicator. Many Forex traders use the Stochastic Indicator in different ways, but its main function is to tell you where the market conditions are. Overbought or Oversold?
Remember,
Overbought = 80+ = Sell
Oversold = -20 = Buy
Stochastic Indicator But no one can tell you that it will always work this way. One thing to remember, all indicators help a trader to take a rough position on his or her position, but never will an indicator give you the right direction.
These will act as your Assistant whenever you trade but you will never be their Assistant.
নতুন সেবা


