

May 5, 2021
Estimated reading time: < 1 min
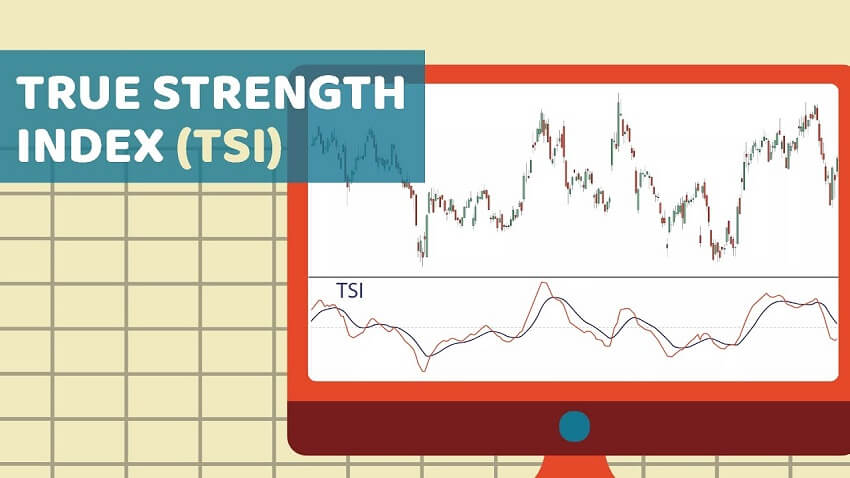
The True Strength Index (TSI) is a momentum oscillator that ranges between limits of -100 and +100 and has a base value of 0.
Momentum is positive when the oscillator is positive (pointing to a bullish market bias).
Momentum is negative when the oscillator is negative (pointing to a bearish market bias).
It was developed by William Blau and consists of 2 lines:
- The index line
- An exponential moving average of the TSI, called the signal line
Traders may look for any of the following five types of conditions:
- Overbought
- Oversold
- Centerline crossover
- Divergence
- Signal line crossover.
TSI is useful for determining overbought and oversold conditions, indicating potential trend direction changes via centerline or signal line crossovers, and warning of trend weakness through divergence.
The indicator is often used in combination with other signals.
If you liked this article, then please subscribe to our Newsletter Services for Forex Related updates. You can also find us on Facebook and can subscribe to our YouTube channel. You can also join our Telegram Channel for real-time trading analysis and discussion. Here is our service sitemap. If you have any confusion please leave your comments below.
Views: 125


