

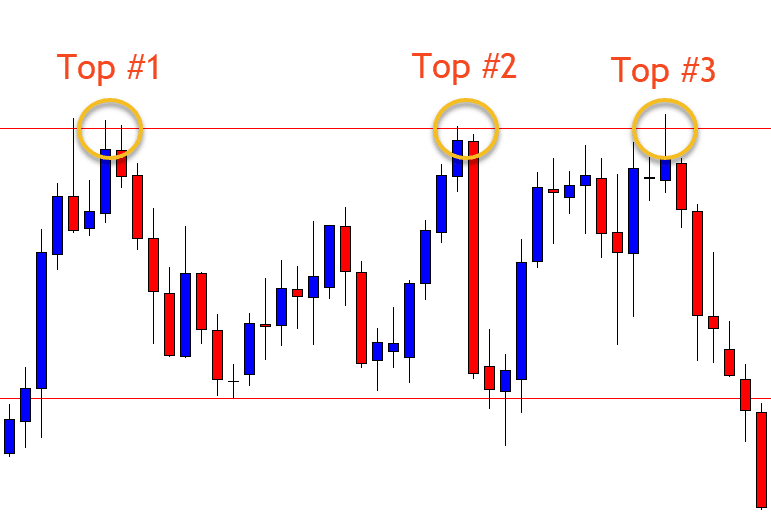
A Triple Top is a chart pattern that consists of three equal highs followed by a break below support.
The chart pattern is categorized as a bearish reversal pattern.
All three highs should be reasonably equal, well-spaced, and mark clear turning points to establish resistance.
The highs do not all have to exactly the same level but should be “close enough”.
That said, when the last high fails to reach the middle high’s value, the trend might be getting exhausted, and a stronger decline can be expected.

The Triple Top pattern is similar in appearance to the Head and Shoulders pattern, in that it is represented by a series of three high highs and lows.
The difference is that all three highs of the Triple Top will be around the same height, while in the Head and Shoulders pattern, the second high is higher than the first and third high.
The appearance of the Triple Top indicates the existence of an uptrend, which is currently in the process of reversing into a downtrend.
Buying pressure is declining so the uptrend is running out of steam.
As with a Triple Bottom, it is generally thought that the longer a particular trend takes to fully develop, the stronger the significant change in price once a breakdown occurs.
Triple Tops and Bottoms are considered one of the slowest types of chart patterns to fully mature.
While the Triple Top is developing, it can look like other chart patterns.
For example, before the third high forms, the pattern may look like a Double Top.
Three equal highs can also be found in an Ascending Triangle or Rectangle.
With a Triple Top, the support level can be identified by drawing a line at the base level of the lows, which forms a “Neckline“.
You can choose to enter into a short position once the price level falls through this support level.
Preceding trend intensity is also important. A Triple Top emerging after a steep uptrend might be expected to result in a steeper decline.
The Triple Top should also be treated as a neutral chart pattern until a breakdown (downside breakout) occurs.
If you liked this article, then please subscribe to our Newsletter Services for Forex Related updates. You can also find us on Facebook and can subscribe to our YouTube channel. You can also join our Telegram Channel for real-time trading analysis and discussion. Here is our service sitemap. If you have any confusion please leave your comments below.


