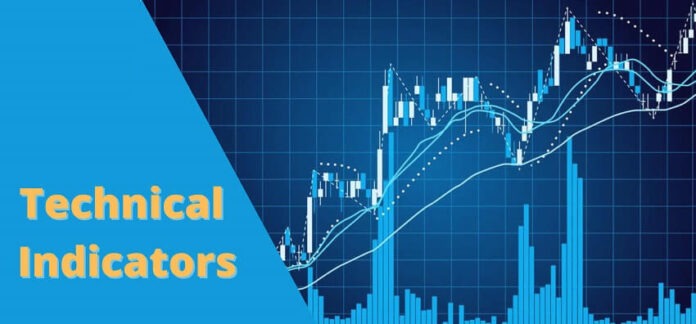
A technical indicator is a mathematical calculation that can be applied to price and volume data. It can be even applied to another technical indicator.
The result is a value that is used to anticipate future changes in prices.
Technical indicators are the squiggly lines found above, below, and on top of the price information on a chart.
They are used by forex traders who follow technical analysis.
A technical indicator offers a different perspective from which to analyze the strength and direction of the underlying price action.
By analyzing historical data, technical analysts use indicators to predict future price movements
A technical indicator can serve three functions:
- Alert traders about a specific condition being met.
- Predict the direction of price.
- Confirm analysis suggested by current price action or by another technical indicator.
Two Categories of Technical Indicators
There are two categories of technical indicators:
- Leading indicators give trade signals where a trend is about to start
- Lagging indicators follow the price action.
Leading indicators try to predict price by using a shorter period in their calculation, which leads to the price movement. The most popular leading indicators are MACD, RSI, and Stochastic.
These indicators typically work by measuring how “overbought” or “oversold” an asset is. The assumption is that when something is “oversold” it will bounce back.
Lagging indicators give a signal after the trend or reversal has started. The most common lagging indicator is the Moving Average.
They don’t warn you of upcoming changes in prices, they simply tell you what prices are doing ( rising or falling) so that you can trade accordingly.
Lagging indicators have you buy and sell late, but in exchange for missing the early opportunities, they greatly reduce your risk by keeping you on the right side of the market.
The general approach is that you should use lagging indicators during trending markets and leading indicators during sideways markets.
Chart Placement of Technical Indicators
Regarding where a technical indicator is placed on a chart, there are two classes of technical indicators:
- Overlays: Technical indicators that use the same scale as prices are plotted over the top of the prices on a chart. Examples include moving averages and Bollinger Bands.
- Oscillators: Technical indicators that oscillate between a local minimum and maximum are plotted above or below a price chart. Examples include MACD, RSI, and Stochastic.
Four Types of Technical Indicators
There are four types of technical indicators:
- Trend-Following
- Momentum
- Volatility
- Volume
Trend-Following Indicators
Trend following indicators help traders trade currency pairs that are trending up or trending down.
These indicators can help point out the direction of the trend and can tell us if a trend actually exists.
Trend-following indicators measure the direction and strength of a trend, using some form of price averaging.
As price moves above the average, it is considered to be in a bullish trend. When price moves below the average, it signals a bearish trend.
Here are examples of trend-following indicators:
- Moving averages are used to identify current trends, as well as support and resistance levels.
- MACD is used to reveal changes in the strength, direction, momentum, and duration of a trend.
- Parabolic SAR is used to find potential reversals in the price’s direction.
Momentum Indicators
Momentum indicators help identify the speed of price movements by comparing prices over time. It can also be used to analyze volume.
It is calculated by comparing the current closing price to the previous closing prices.
Typically, this appears as a line below a price chart that oscillates as momentum changes.
When there is a divergence between price and a momentum indicator, it can signal a change in future price direction.
Here are examples of momentum indicators:
- Stochastic shows the location of the closing price relative to the high-low range over a set number of periods.
- CCI is an oscillator that helps identify cyclical turns or trend reversals.
- RSI measures the strength or weakness of a currency pair by comparing its up movements versus its down movements over a given time period.
Volatility Indicators
Volatility indicators measure the rate of price movements, regardless of direction.
This is generally based on a change in the highest and lowest historical prices.
They provide useful information about the range of buying and selling that take place in a given market and help traders determine points when they may change direction.
Here are examples of volatility indicators:
- Bollinger Bands help determine whether prices are high or low on a relative basis
- Average True Range measures volatility, taking into account any gaps in the price movement.
- Standard Deviation is the statistical measure of market volatility, measuring how widely prices are dispersed from the average price.
Volume Indicators
Volume indicators measure the strength of a trend or confirm a trading direction on some form of averaging (or smoothing) of volume.
The strongest trends often occur while volume increases.
Here are examples of volume indicators:
- Chaikin Money Flow (CMF) measures the volume-weighted average of accumulation and distribution over a specified period. The principle behind the Chaikin Money Flow is the nearer the closing price is to the high, the more accumulation has taken place.
- On Balance Volume (OBV) measures buying and selling pressure as a cumulative indicator that adds volume on up days and subtracts volume on down days.
- Volume Oscillator (VO) displays the difference between two moving averages of a security’s volume expressed as a percentage. It works on the premise that t is not the actual level of volume, but the change in volume relative to the recent past that has more technical significance.
How to Minimize False Signals
No technical indicator is foolproof.
To minimize false signals, where the price movement differs from what was expected from the indicator, a technical indicator is often combined with other “tests” or with other indicators to increase its reliability.
This is known as waiting for “confirmation” of the signal that the technical indicator generates.
The additional tests are called “filters“.
The most common filters can be classified in the following categories:
- Time: the signal must be present for a specified amount of time. For instance, a 50-day moving average must be above a 200-day moving average for at least 3 trading days.
- Magnitude: the signal must be in a specified range. For example, an oscillator must be more than 80% or less than 20%.
- Volume: indicators usually have more significance when they are based on higher volume.
Some indicators work better over specific time horizons, so it makes sense to choose those indicators that are suitable for your trading horizon.
The frequency of trading signals is another factor to consider.
If you are a day trader, you’d want indicators that generate many trading signals in a day. A swing trader would want fewer signals.
Using a combination of indicators and price action analysis usually results in fewer signals and lower trading costs.
Always remember that technical indicators are just that….indicators.
They are not guarantees that a price will move a certain way.
With technical analysis, you usually don’t know for sure whether it’s a true trend reversal or a fake one until after the fact.
That’s why looking at charts with multiple time frames is recommended to add context to your views.
If you liked this article, then please subscribe to our Newsletter Services for Forex Related updates. You can also find us on Facebook and can subscribe to our YouTube channel. You can also join our Telegram Channel for real-time trading analysis and discussion. Here is our service sitemap. If you have any confusion please leave your comments below.


