

A Moving Average (MA for short) is a technical indicator that averages a currency pair’s price over a period of time.
Moving averages are highly popular among forex traders, mostly because of its simplicity.
In statistics, a moving average is simply a mean of a certain set of data.
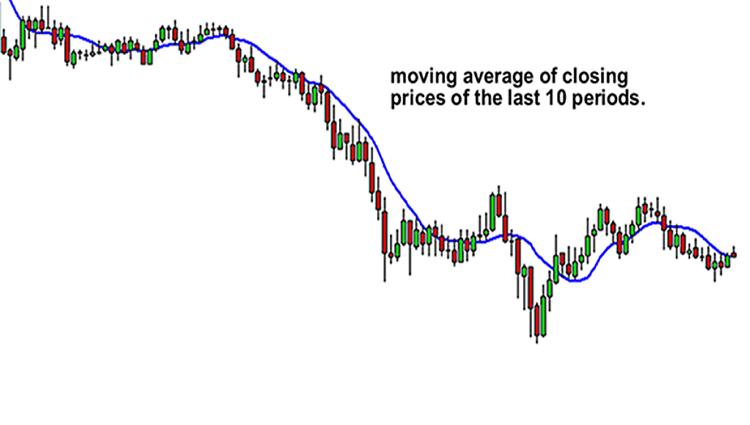
In the case of technical analysis, these data are in most cases represented by closing prices of currency pairs for a certain time period.
Calculating an MA requires a certain amount of data, which can be a large quantity depending on the length of the moving average.
For example, a five-day MA will require five days of data, while a 200-day MA will require 200 days’ worth.
The indicator is described as “moving” because the introduction of new figures will replace old data points and ‘move’ the line on the chart.
The smoothing effect this has on the chart helps give a clearer indication of which direction the pair is moving: up, down, or sideways.
Moving average is a trend-following indicator.
Its purpose is to detect the start of a trend, follow its progress, as well as to indicate its reversal if it occurs.
As opposed to charting, moving averages do not anticipate the start or the end of a trend. They only confirm it, but only sometime after the actual reversal occurs.
This is due to their very construction, as these indicators are based solely on historical data.
The fewer days a moving average contains, the sooner it can detect a trend’s reversal. It is because of the amount of historical data, which strongly influences the average.
For example, a 5-day moving average generates the signal of a trend reversal sooner than the 20-day average.
Trading Signals
Any type of moving average can be used to generate buy or sell signals and this process is very simple.
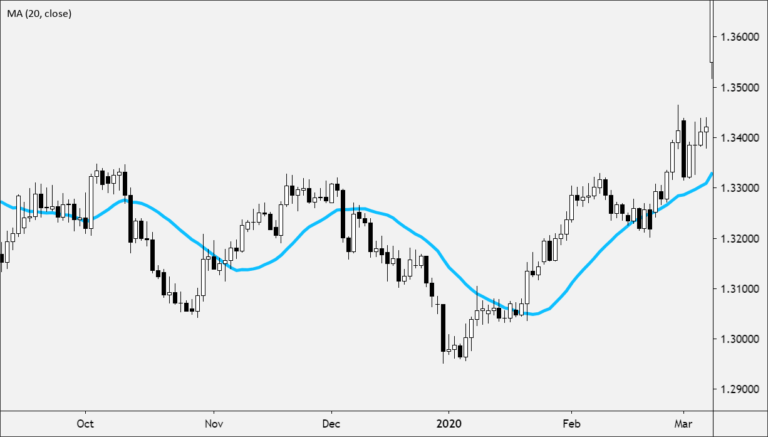
The charting software plots the moving average as a line directly into the price chart.
Signals are generated in places where prices intersect or “cross over” these lines.
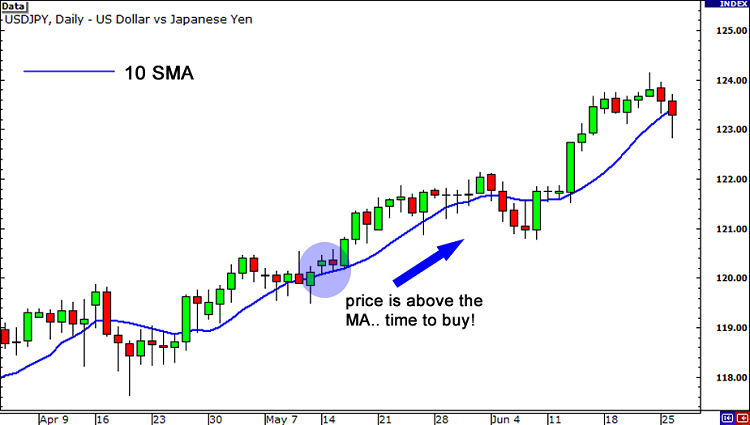
- If the price crosses above the moving average line, it implies the start of a new upward trend and triggers a buy signal.
- If the price crosses under the moving average line, it implies the start of a new downtrend and triggers a sell signal.
Using Multiple Moving Averages
Using a single moving can be prone to false signals due to noisy price action.
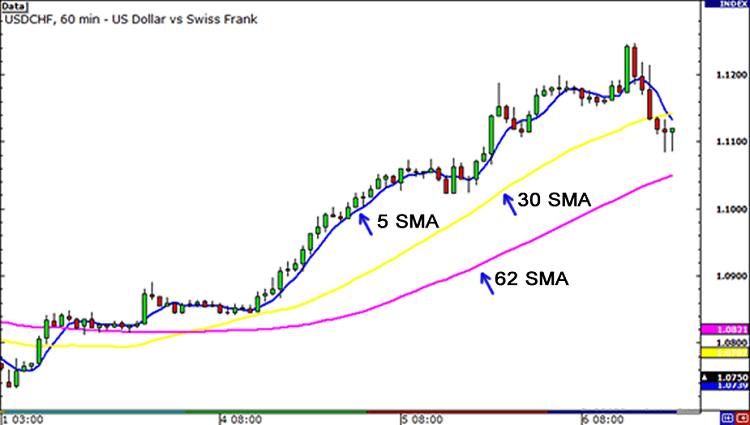
One way to help to eliminate the “noise” in prices is to use multiple moving averages simultaneously.
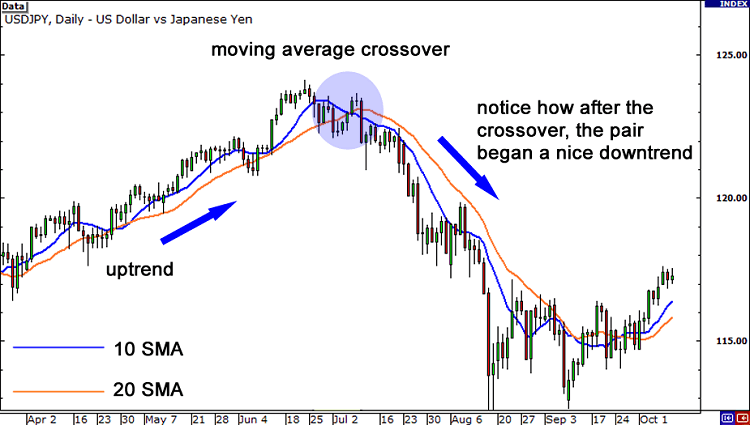
Here’s how to use TWO moving averages:
- A buy signal occurs when the shorter of the moving averages crosses above the longer average. For example, if the 10-day average crosses above the 20-day average.
- A sell signal is generated when the 10-day average crosses under the 20-average.
Here’s how to use THREE moving averages:
- Let’s say you apply a 10-day, 50-day, and 200-day average.
- An upward trend is indicated if the 10-day average line is above the 50-day moving average, while the 50-day average is still above the 200-day average.
- Any crossing of moving averages that leads to this situation is considered a buy signal.
- A downward trend is indicated by the situation when the 10-day average line is lower than the 50-day average, while the 50-day average is lower than the 200-day average.
Using three moving averages simultaneously limits the number of false signals generated by the system, but it also limits the potential for profit.
This is due to the fact that such a system only generates a trading signal after the trend is firmly established.
Advantages and Disadvantages
| Advantages | Disadvantages |
|
When using moving averages to generate trading signals, you always trade in the direction of the trend, not against it. Compared to chart patterns analysis or other subjective techniques, moving averages can be used to generate trading signals based on clear rules. This removes the subjectivity of trading decisions, which can help the trader’s mental state. |
Moving averages only work well when the price is trending. When prices fluctuate in a range or trade “sideways”, they do not work at all. Such price action occurs frequently, so relying on moving averages alone is very risky. |
Types of Moving Averages
There is a variety of moving averages to choose from.
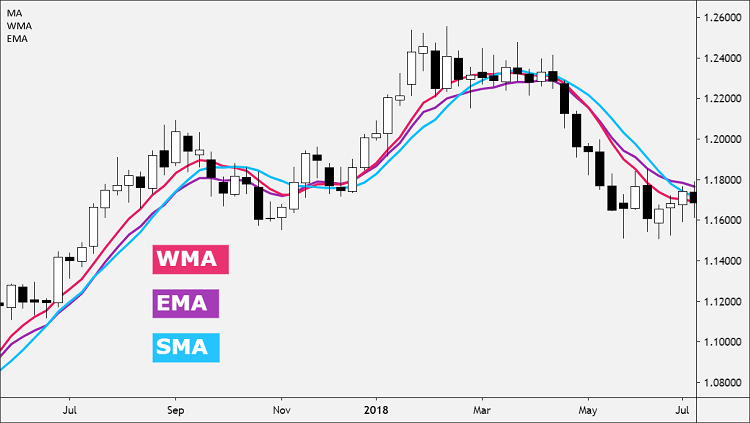
Simple Moving Averages and Exponential Moving Averages and Weighted Moving Averages are by far the most popular.
A Simple Moving Average (SMA) is the most basic MA, which is just a straight calculation of the mean price of a set of values over a given time period.
If you were to calculate the SMA for a twenty-day period, you would take the values of the last 20 days and divide the result by 20.
An Exponential Moving Average (EMA), gives more importance to recent prices to make the data more responsive than the SMA.
A Weighted Moving Average (WMA) puts even greater importance on recent data than the Exponential Moving Average (EMA) by assigning values that are linearly weighted to ensure that the most recent prices have a greater impact on the average than older prices.
You don’t really need to know how to manually calculate each type of moving average as most trading platforms will do the calculations for you automatically.
If you liked this article, then please subscribe to our Newsletter Services for Forex Related updates. You can also find us on Facebook and can subscribe to our YouTube channel. You can also join our Telegram Channel for real-time trading analysis and discussion. Here is our service sitemap. If you have any confusion please leave your comments below.


