

MACD Introduction
The MACD or “Moving Average Convergence / Divergence” indicator is a momentum oscillator used to trade trends.
MACD plots the distance between moving averages and helps traders identify trend direction and whether the bullish or bearish momentum in the price is strengthening or weakening.
Although MACD is an oscillator, it is NOT typically used to identify overbought or oversold conditions.
The MACD is a trend-following indicator since its purpose is to show the differences between two moving averages (MAs).
The difference between the two MAs is plotted as one line and a second line plots a “smoothed” version of the first line.
These two lines appear on a chart as a technical indicator and oscillate without boundaries.
The crossover of the two lines gives trading signals similar to a moving average crossover system.
The MACD indicator also provides a signal line, which is an average of the differences between the two moving averages.
When the MACD crosses above the signal line, an uptrend may be emerging.
Conversely, when it falls below the signal line, a downtrend may be emerging.
The difference between the MACD and signal values is plotted as a histogram, which may sometimes give you an early sign that a crossover is about to happen.
How does MACD work?
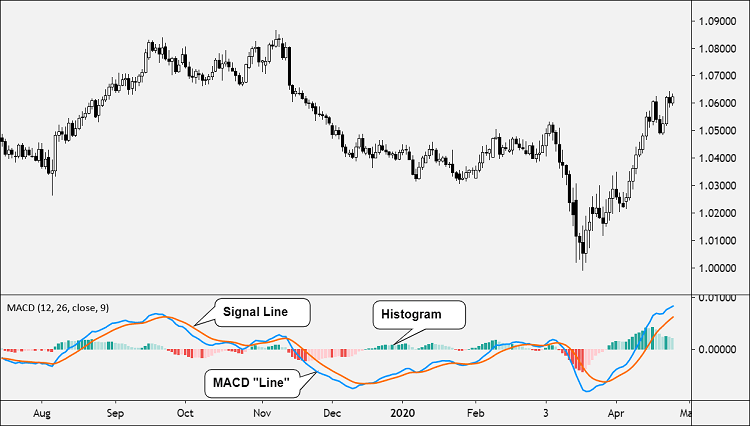
The MACD indicator works using three components:
- Line (the “MACD”)
- Line (the “Signal Line”)
- Histogram
The first line, the “MACD” is the difference between two moving averages, usually the 12-period EMA and 26-period EMA.
Make sure you understand the difference between “MACD the indicator” versus “MACD the line”.
Why did Gerald Appel, the creator, decide to label two different things with the same name? Who knows.
The second line, the “Signal Line” is the moving average of the first line. Usually, a 9-period EMA. Said differently, it’s the moving average of the MACD.
This means that that the MACD line is considered the “faster” line, while the Signal Line is considered the “slower” line.
If the two lines come together, they are said to be “converging” and if they move away from each other they are “diverging“.
The difference between the two lines is represented on the histogram.
If the MACD is plotted above the zero line, this signals an uptrend.
If the MACD is plotted above below the zero line, this signals a downtrend.
How to Trade?
There are four common MACD trading strategies:
- Zero Crosses
- MACD / Signal Line Crossovers
- Histogram Reversals
- MACD Divergence
Zero Crosses
When the MACD crosses above zero, this is considered bullish.
When the MACD crosses below zero, this is considered bearish.
On the chart below, the Signal Line and Histogram are removed to make the example clearer.
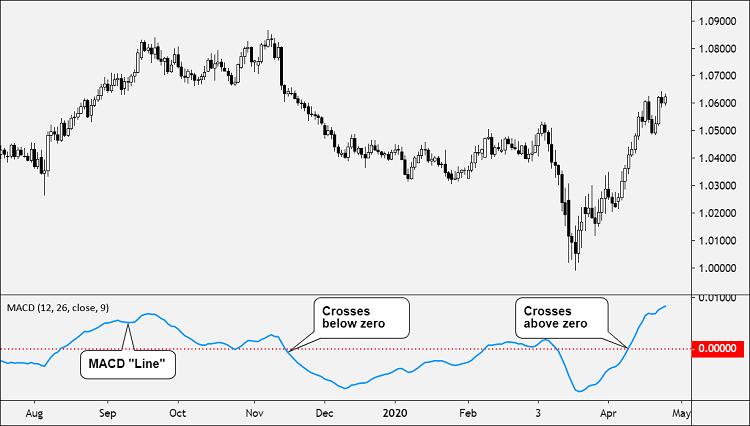
Some traders also like to watch the Signal Line as well and look for it to cross above and below zero to generate trading signals.
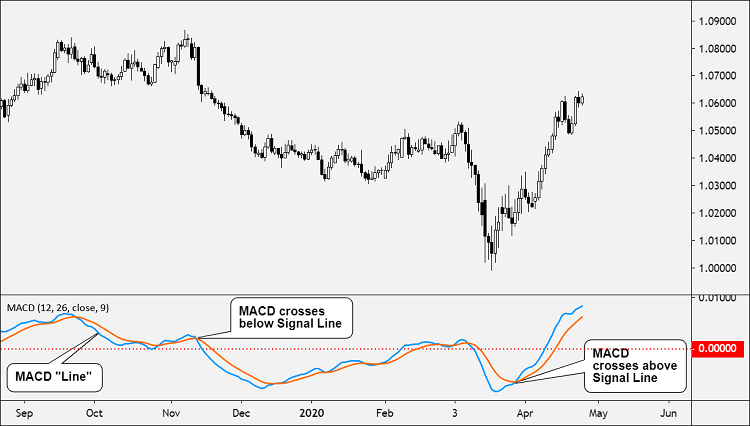
Signal Line Crossovers
Like with most crossover strategies, a buy signal comes when the “faster” line crosses above the “slower” line. And vice versa for a sell signal.
Here, the MACD is the faster line, while the Signal Line is the slower line.
When the MACD line crosses from below to above the Signal Line, the indicator is considered bullish. The further below the zero line, the stronger the signal.
When the MACD line crosses from above to below the Signal Line, the indicator is considered bearish. The further above the zero line, the stronger the signal.
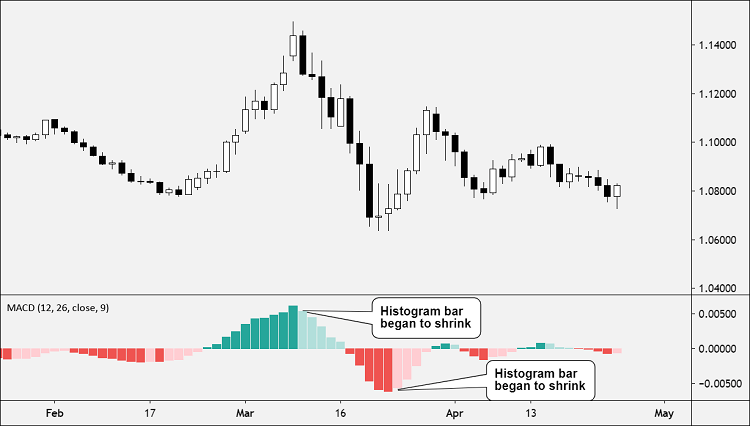
Histogram Reversals
The Histogram represents the difference between the MACD and Signal Line.
This means that as the bars on the Histogram move further away from zero, the two lines are moving further apart.
When the price’s momentum is strong, the Histogram will increase in heigh
When the Histogram shrinks, it is a sign that the momentum (whether bullish or bearish) is weakening.
Once the initial momentum surge is over, a mound or hump shape will emerge.
This is a signal that the moving averages are tightening again, which can be an early sign that a crossover is about to happen.
This is a predictive approach, instead of the reactive approach that the crossover strategies take.
The Histogram reversal is based on using the existing trend as the basis for entering a position, which means the strategy can be executed before the price movement actually occurs.
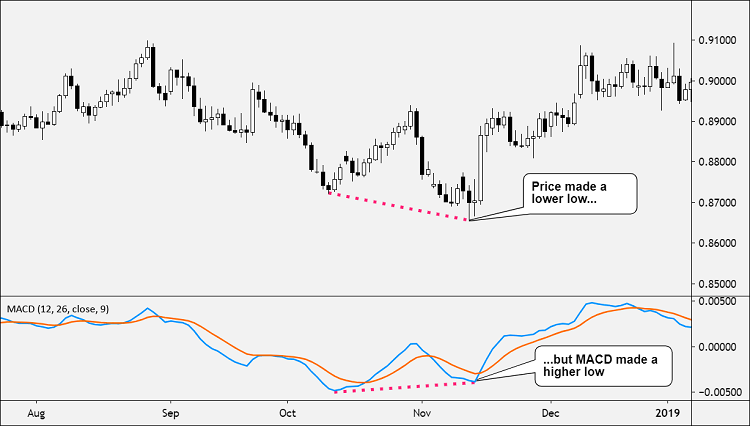
MACD Divergence
The divergence between the MACD and the price is a strong signal.
When price makes a lower low (or higher high), MACD should also make a lower low (or higher high).
Both should move in the same direction. But when it doesn’t, there is divergence.
In the example below, the price made a lower low but MACD made a higher low.
This divergence between price and MACD signals a possible trend change.
In this case, MACD is hinting that the downtrend might be done.
Think of the MACD divergence as an early warning sign for trend reversals (or at least, choppy market conditions ahead).
Calculation
MACD, more specifically, the MACD “line” is calculated by subtracting the longer EMA (26 periods) from the shorter EMA (12 periods).
MACD = 12-Period EMA − 26-Period EMA
An exponential moving average (EMA) is a type of moving average (MA) that places a greater weight and significance on the most recent price.
The shorter EMA is constantly converging toward, and diverging away from, the longer EMA. This causes MACD to oscillate around the zero levels.
The Signal Line is created with a 9-period EMA of the MACD line.
If you liked this article, then please subscribe to our Newsletter Services for Forex Related updates. You can also find us on Facebook and can subscribe to our YouTube channel. You can also join our Telegram Channel for real-time trading analysis and discussion. Here is our service sitemap. If you have any confusion please leave your comments below.


