

Japanese Candlestick Trading
Back in the day when Godzilla was still a cute little lizard, the Japanese created their own old-school version of technical analysis to trade rice. That’s right, rice.
Traders are hustin’ back then also. To rock ice, you traded rice. 💎
A Westerner by the name of Steve Nison “discovered” this secret technique called “Japanese candlesticks,” learning it from a fellow Japanese broker.
Steve researched, studied, lived, breathed, ate candlesticks, and began to write about it.
Slowly, this secret technique grew in popularity in the ’90s.
To make a long story short, without Steve Nison, candlestick charts might have remained a buried secret.
Steve Nison is Mr. Candlestick.
What are Japanese candlesticks?
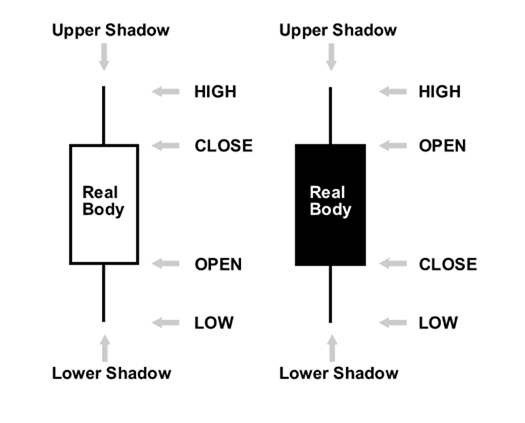
The best way to explain is by using a picture:
Japanese candlesticks can be used for any time frame, whether it be one day, one hour, 30-minutes ….whatever you want!
They are used to describe the price action during the given time frame.
Japanese candlesticks are formed using the open, high, low, and close of the chosen time period.
- If the close is above the open, then a hollow candlestick (usually displayed as white) is drawn.
- If the close is below the open, then a filled candlestick (usually displayed as black) is drawn.
- The hollow or filled section of the candlestick is called the “real body” or body.
- The thin lines poking above and below the body display the high/low range and are called shadows.
- The top of the upper shadow is the “high“.
- The bottom of the lower shadow is the “low“.
The longer the body is, the more intense the buying or selling pressure. This means that either buyers or sellers were stronger and took control.
Short bodies imply very little buying or selling activity. In trading lingo, bulls mean buyers and bears mean sellers.
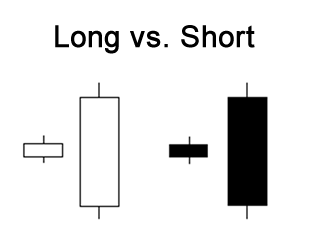
Long white Japanese candlesticks show strong buying pressure.
The longer the white candlestick, the further the close is above the open.
This indicates that prices increased considerably from open to close and buyers were aggressive. In other words, the bulls were kicking the bears’ butts big time!
Long black (filled) candlesticks show strong selling pressure.
The longer the black Japanese candlestick, the further the close is below the open.
This indicates that prices fell a great deal from the open and sellers were aggressive. In other words, the bears were grabbing the bulls by their horns and body-slamming them.
Mysterious Shadows
No, we’re not talking about wearing dark smokey eye shadow.
The upper and lower shadows on Japanese candlesticks provide important clues about the trading session.
Upper shadows signify the session high.
Lower shadows signify the session low.
Candlesticks with long shadows show that trading action occurred well past the open and close.
Japanese candlesticks with short shadows indicate that most of the trading action was confined near the open and close.
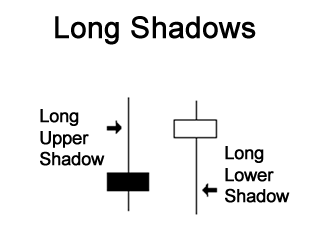
But for one reason or another, sellers came in and drove prices back DOWN to end the session back near its open price.
If a Japanese candlestick has a long lower shadow and short upper shadow, this means that sellers flashed their washboard abs and forced the price lower.
But for one reason or another, buyers came in and drove prices back UP to end the session back near its open price.


