

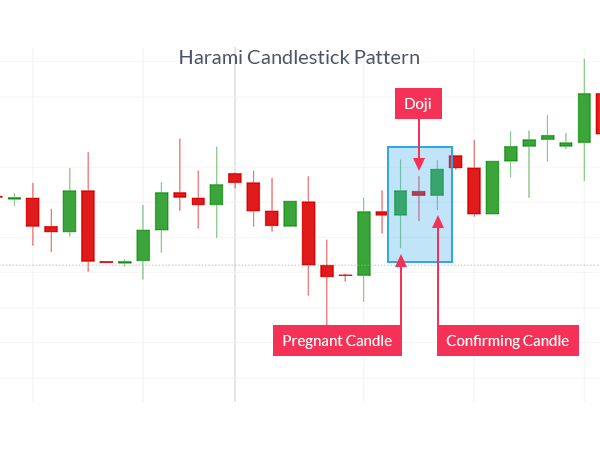
The Harami pattern consists of two candlesticks with the first candlestick being a large candlestick and the second being a small candlestick whose body is contained within the first candle’s body.
Harami means “conception” or “pregnant” in Japanese.
The first candlestick is seen as the “mother” with a large real body that completely enclosing or embodies the smaller second candlestick, creating the appearance of a pregnant mother.
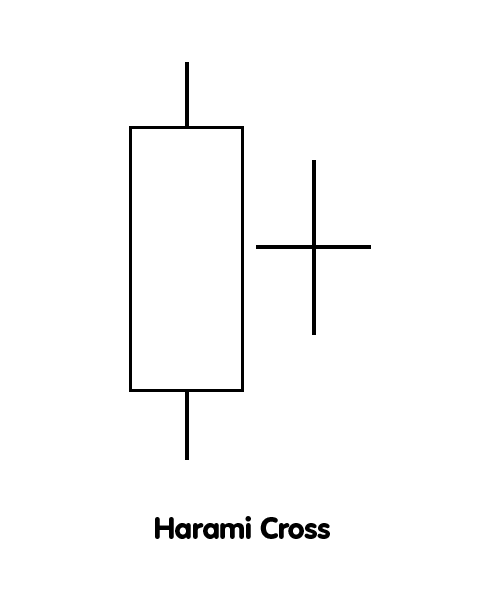
The second candlestick may appear as a Spinning Top or a Doji.
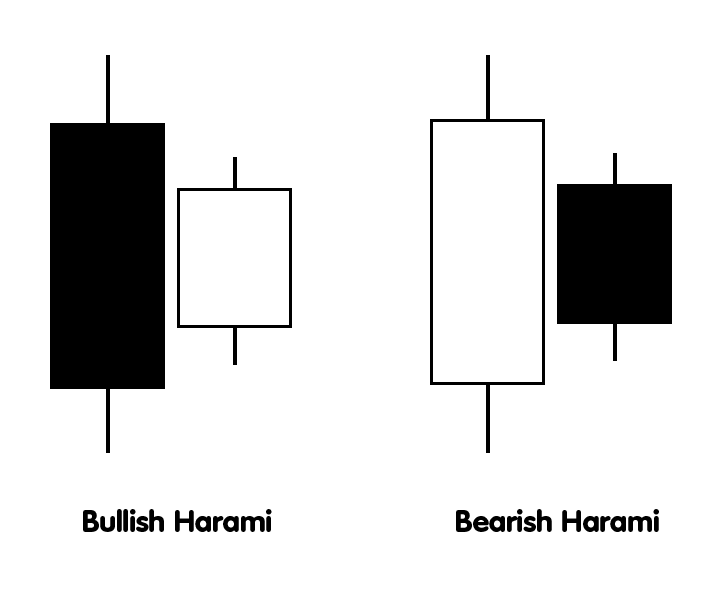
The Harami candlestick pattern comes in two different forms:
- Bullish Harami: a bullish reversal pattern (which occurs after a downtrend).
- Bearish Harami: a bearish reversal pattern (which occurs after an uptrend).
When the second candlestick is a Doji, the pattern is called a Harami Cross.
Recognition Criteria
To identify a general Harami pattern, look for the following criteria:
- There is a prevailing trend, whether it’s an uptrend or a downtrend.
- The first candle must continue with the trend’s direction. It will be the same color as the current trend, and it will have a long body.
- The second candle must be contained within the first candle’s body (so it opens and closes within the body of the first candle). It can be either color, and it will have a smaller body. Only the body needs to be contained within the first candle; the wicks are irrelevant.
Bullish Harami
- Price is an established downtrend.
- The first candle is a large bearish candle.
- The second candle is a smaller bullish candle.
- When the second candle opens, price gaps up after the first candle but its body is contained within the body of the first candle.
Bearish Harami
- Price is an established uptrend.
- The first candle is a large bullish candle.
- The second candle is a smaller bearish candle.
- When the second candle opens, price gaps down after the first candle but its body is contained within the body of the first candle.
Meaning
The Harami is a trend reversal pattern and must appear in an existing trend.
The color of the second candlestick is not important. Usually, the second candlestick will be the opposite color of the first candlestick, but not always.
What IS important is the location of the Harami within an existing trend and the direction of that trend.
This should be seen in the context of the chart.
If the Harami appears at or near a support or resistance line, or a trend line, it becomes more significant.
When the Harami appears in an uptrend it is a bearish signal.
When it appears in a downtrend it is a bullish signal.
The appearance of the Harami, and the short real body of the second candlestick, is a signal that indecision and uncertainty following a sudden surge in movement of the trend are causing the trend to lose momentum.
In an uptrend, it means that buyers have failed to follow up on the surge of activity and close the second candlestick at or near the high of the previous candlestick.
A Bullish Harami’s first candle indicates that the current downtrend is continuing and the bears are pushing the price lower.
However, the bulls then step in and the price opens higher than the previous candle’s close. The bulls are now in control and the price goes up.
In a downtrend, it means that sellers have failed to close the second candlestick near the low of the previous candlestick.
A Bearish Harami’s first candle indicates that the current uptrend is continuing and the bulls are pushing the price higher.
However, the bears then step in and the price opens lower than the previous candle’s close. The bulls take profit and exit before the price closes lower for the session.
In both cases, this weakness indicates that a trend reversal may be imminent.
To analyze a specific Harami candlestick, observe the following:
- The longer the candles, the more forceful the reversal should be.
- In a Bullish Harami, the higher the second candle closes up on the black candle, the more likely it is that a reversal will occur.
- In a Bearish Harami, the lower the second candle closes down on the white candle, the more likely it is that a reversal will occur.
If you liked this article, then please subscribe to our Newsletter Services for Forex Related updates. You can also find us on Facebook and can subscribe to our YouTube channel. You can also join our Telegram Channel for real-time trading analysis and discussion. Here is our service sitemap. If you have any confusion please leave your comments below.


