

Bollinger Bands (BB) is a popular technical indicator created by John Bollinger that helps determine whether prices are high or low on a relative basis.
Bollinger Bands (BB) were created in the early 1980s by trader, analyst, and teacher John Bollinger.
The indicator filled a need to visualize changes in volatility.
Traders generally use Bollinger Bands to determine overbought and oversold zones, to confirm divergences between prices and indicators, and to project price targets.
Bollinger Bands consist of a band of three lines that are plotted in relation to prices.
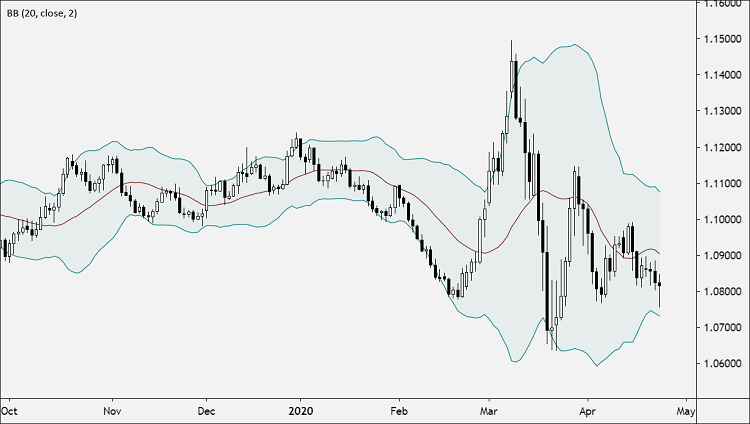
The three lines:
- Upper Band
- Middle Line
- Lower Band
The line in the middle is usually a Simple Moving Average (SMA) set to a period of 20 days
The SMA then serves as a base for the Upper and Lower Bands.
The Upper and Lower Bands are used as a way to measure volatility by observing the relationship between the Bands and price.
Typically the Upper and Lower Bands are set to two standard deviations away from the SMA (The Middle Line), but can usually be adjusted by the trader.
As volatility increases, the wider the bands become. Likewise, as volatility decreases, the gap between bands narrows.
Parameters
- Period (20) – the number of bars, or period, used to calculate the study. John Bollinger recommends an optimal period of 20 or 21 periods and warns that periods of less than ten periods do not seem to work well.
- Band Width (2) – The half-width of the band in terms of multiples of standard deviation. Typically, “2” is used.
Calculation
First, calculate a simple moving average. Next, calculate the standard deviation (SD) over the same number of periods as the simple moving average (SMA).
For the upper band, add the standard deviation(SD) to the simple moving average (SMA). For the lower band, subtract the standard deviation (SD) from the simple moving average. (SMA)
Typical values used:
- Short term: 10-period moving average, bands at 1.5 standard deviations. (1.5 times the standard dev. +/- the SMA)
- Medium-term: 20-period moving average, bands at 2 standard deviations.
- Long-term: 50-period moving average, bands at 2.5 standard deviations.
How Bollinger Bands Work
- When the bands tighten during a period of low volatility, it raises the likelihood of a sharp price move in either direction. This may begin a trending move. Watch out for a false move in the opposite direction which reverses before the proper trend begins.
- When the bands separated by an unusually large amount, volatility increases and any existing trend may be ending.
- Prices have a tendency to bounce within the bands’ envelope, touching one band then moving to the other band. You can use these swings to help identify potential profit targets. For example, if a price bounces off the lower band and then crosses above the moving average, the upper band then becomes the profit target.
- Price can exceed or hug a band envelope for prolonged periods during strong trends. On divergence with a momentum oscillator, you may want to do additional research to determine if taking additional profits is appropriate for you.
- A strong trend continuation can be expected when the price moves out of the bands. However, if prices move immediately back inside the band, then the suggested strength is negated.
How to Use Bollinger Bands
Traders generally use Bollinger Bands to determine overbought and oversold zones, to confirm divergences between prices and studies, and to project price targets.
The wider the bands, the greater the volatility. The narrower the bands, the lesser the volatility.
Some traders use Bollinger Bands with other technical indicators, such as RSI.
- If price touches the Upper Band and the other technical indicator does not confirm the upward move (i.e. there is divergence), a sell signal is generated.
- If the other technical indicator confirms the upward move, no sell signal is generated, and in fact, a buy signal may be indicated.
- If the price touches the Lower Band and the other technical indicator does not confirm the downward move, a buy signal is generated.
- If the other technical indicator confirms the downward move, no buy signal is generated, and in fact, a sell signal may be indicated.
Another strategy is to the Bollinger Bands by itself.
- In this approach, a chart top occurring above the Upper Band followed by a top below the upper band generates a sell signal.
- On the other hand, a chart bottom occurring below the Lower Band followed by a bottom above the lower band generates a buy signal.
Bollinger Bands also help determine overbought and oversold markets.
- When prices move closer to the upper band, the currency pair is becoming overbought, and as the prices move closer to the lower band, the currency pair is becoming oversold.
- The price momentum should also be taken into account. When a price enters an overbought or oversold area, it may become even more so before it reverses.
- You should always look for evidence of price weakening or strengthening before anticipating a trend reversal.
Bollinger Bands differ from similar indicators such as Keltner Channels or Moving Average Envelopes in such a way that the width of the range is not constant, but it changes according to historical volatility.
If volatility increases, the band becomes wider, and if volatility decreases, the band becomes narrower.
- A significant widening of the band may signal the end of a trend.
- A significant narrowing of the band implies the start of a new trend.
Summary
Bollinger Bands are comprised of a Middle band (SMA), and Upper and Lower Bands based on Standard Deviation (SD) which contract and widen with volatility.
The Bands are a useful tool for analyzing trend strength and monitoring when a reversal may be occurring.
Bollinger Bands are not predictive though. They are always based on historical information and therefore react to price changes, but don’t anticipate price changes.
Like other indicators, Bollinger Bands are best used in conjunction with other indicators, price analysis, and risk management as part of an overall trading plan.
If you liked this article, then please subscribe to our Newsletter Services for Forex Related updates. You can also find us on Facebook and can subscribe to our YouTube channel. You can also join our Telegram Channel for real-time trading analysis and discussion. Here is our service sitemap. If you have any confusion please leave your comments below.


