

The Average True Range (ATR) is a technical indicator that measures the volatility of an asset’s price. Since ATR is a volatility indicator. it shows how much price fluctuates, on average, during a given time frame.
It was introduced by Welles Wilder in his book, “New Concepts in Technical Trading Systems“. What’s incredible is that this book also includes the Parabolic SAR, RSI, and the Directional Movement Concept (ADX).
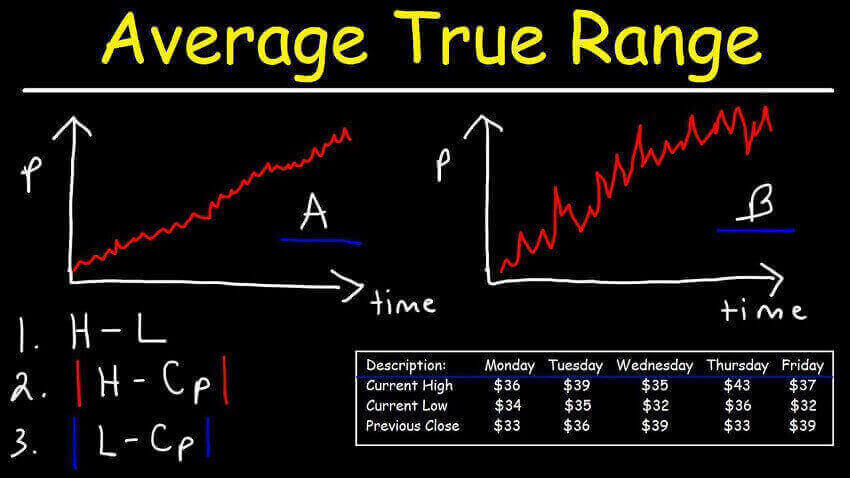
Average True Range can reach a high value when price fluctuations are large and rapid.
Low values of the indicator are typical for the periods of sideways movement of long duration which happen at the top of the market and during consolidation.
Average True Range (ATR) can be interpreted in the following way:
- The higher the value of the indicator, the higher the probability of a trend change.
- The lower the indicator’s value, the weaker the trend’s movement is.
The indicator does not provide an indication of price trend, simply the degree of price volatility.
How to Calculate ATR
In order to calculate the ATR, the True Range needs to be discovered.
True Range takes into account the most current period high/low range as well as the previous period close (if needed).
There are three calculations that need to be completed and then compared against each other.
The True Range (TR) is the largest of the following:
- The Current Period High minus (-) Current Period Low
- The Absolute Value (abs) of the Current Period High minus (-) The Previous Period Close
- The Absolute Value (abs) of the Current Period Low minus (-) The Previous Period Close
True Range = max[(high – low), abs(high – previous close), abs (low – previous close)
The absolute value is used because the ATR does not measure price direction, only volatility. So there should be no negative numbers.
Once you have the True Range, the Average True Range can be plotted.
Think of the ATR as the moving average of the True Range.
Parameters
Period: (14): The number of periods used in the range calculation.
If the chart displays hourly data, then period denotes hours. If daily charts are used, then period denotes days. For weekly charts, the period will stand for weeks, and so on.
Wilder used a period of 7. Other common periods used are 14 and 20.
Interpretation
Welles Wilder developed the Average True Range (ATR) to create a tool to measure volatility.
Using daily charts, Wilder defined the True Range to be the greatest for the following periods:
- The distance from today’s high to today’s low.
- The distance from yesterday’s close to today’s high.
- The distance from yesterday’s close to today’s low.
True Range measures market volatility and is an integral part of indicators such as ADX (Average Directional Movement) or ADXR (Average Directional Movement Rating), and others, to identify the directional movement of a market.
The Average True Range indicator identifies periods of high and low volatility in a market.
High volatility describes a market with ongoing price fluctuation, whereas low volatility is used to label a market with little price activity.
Measuring market volatility can help in identifying buy and sell signals and, additionally, risk potential.
Markets with high price fluctuation offer more risk/reward potential, because prices rise and fall in a short time, giving the trader more opportunities to buy or sell.
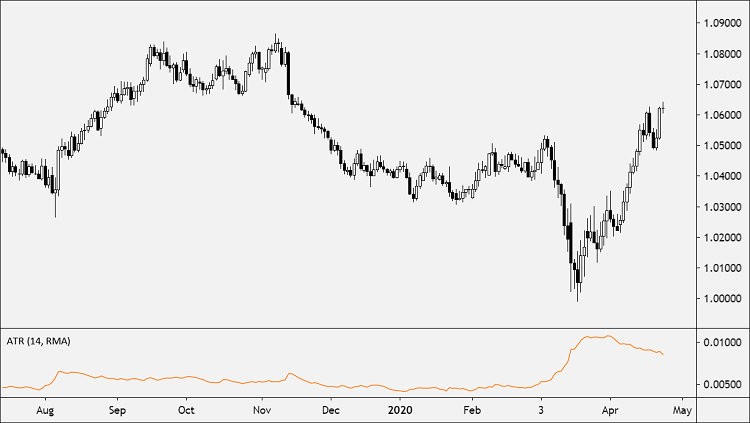
When a market becomes increasingly volatile, the ATR tends to peak rising in value.
During periods of little volatility, the ATR decreases in value.
A market will usually keep the direction of the initial price move, though this is certainly not a rule.
Traders tend to use the Average True Range to measure market volatility and then rely on other technical indicators to help identify market direction.
If you liked this article, then please subscribe to our Newsletter Services for Forex Related updates. You can also find us on Facebook and can subscribe to our YouTube channel. You can also join our Telegram Channel for real-time trading analysis and discussion. Here is our service sitemap. If you have any confusion please leave your comments below.


