The ADX or Average Directional Index is a technical indicator used to measure the overall strength of a trend.
Developed by J. Welles Wilder, the Average Directional Index (ADX) helps traders measure how strongly a price is trending and whether its momentum is increasing or falling.
It’s important to emphasize that while ADX measures the strength of a trend, it does NOT identify the trend’s direction.
It can be used to find out whether the market is ranging or starting a new trend.
The oscillator ranges between 0 and 100 with high readings indicating a strong trend and low readings indicating a weak trend.
ADX is related to the Directional Movement Index (DMI) and, in fact, the DMI has the ADX line included.
How to Use ADX
The ADX takes a different approach when it comes to analyzing trends.
It won’t tell you whether the price is trending up or down, but it will tell you if the price is trending or is ranging.
This makes it useful as an effective filter for either a range or trend strategy by making sure you are trading in sync with current market conditions.
The ADX ranges from 0 to 100.
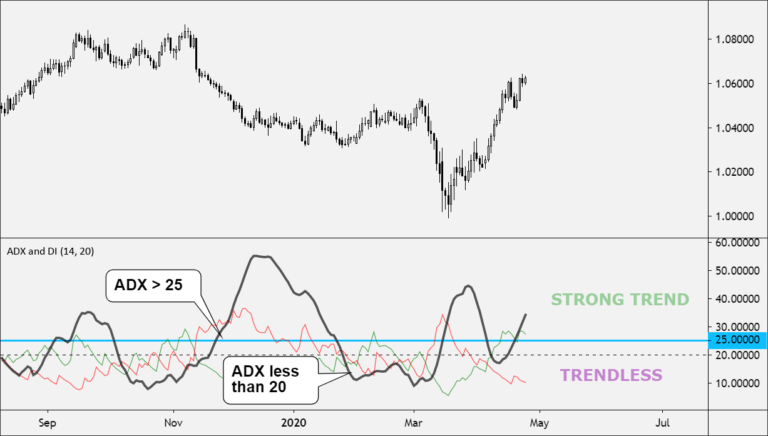
Wilder considered a value above 25 to suggest a trending market, whereas a value below 20 suggests that there is little or no trend.
A value of 0 indicates that the price is equally likely to move in either a positive or negative direction, meaning that there is no overall market trend.
A value of 100 indicates that the price is exclusively moving in either a positive or negative direction, indicating an extremely strong trend.
Here are some guidelines:
- If the ADX value is between 0-20: The trend strength is regarded as absent or weak
- If the ADX value is between 25-50: The trend strength is considered to be strong
- If the ADX value is between 50-75: The trend strength is very strong
- If the ADX value is between 75-100: The trend strength is insanely strong
Values greater than 60 are rare.
Any reading less than 20 is considered to be a weak trend and may signal an impending reversal.
When the ADX turns down from high values, then the trend may be ending. You may want to consider closing any open positions
If the ADX is declining, it indicates that the price possibly becoming less directional, and the current trend is weakening. Be careful using any trend-following systems here.
If ADX has stayed below 20 for a lengthy time and then rises, it may signal to trade the current trend.
If the ADX is rising then the price is showing a strengthening trend.
- The value of the ADX is proportional to the slope of the trend.
- The slope of the ADX line is proportional to the slope of the actual price movement.
- If the price trend is a constant slope, then the ADX value tends to flatten out.
Remember, because the ADX is derived from both positive and negative directional indicators, it only measures TREND STRENGTH rather than TREND DIRECTION.
How to Calculate ADX
The ADX is derived from two-directional indicators, known as DI+ and DI-:
- The positive directional indicator (+DI)
- The negative directional indicator (-DI)
These two indicators are derived from the Directional Movement Index (DMI).
ADX is calculated by finding the difference between DI+ and DI-, as well as the sum of DI+ and DI-.
The difference is divided by the sum, and the resulting number multiplied by 100.
The result is known as the Directional Index or DX.
A moving average is then taken of DX, typically over a fourteen-day period (although any number of periods can be used.)
This final moving average is the ADX.
If you liked this article, then please subscribe to our Newsletter Services for Forex Related updates. You can also find us on Facebook and can subscribe to our YouTube channel. You can also join our Telegram Channel for real-time trading analysis and discussion. Here is our service sitemap. If you have any confusion please leave your comments below.


