

Standard Deviation is the statistical measure of price volatility, measuring how widely prices are dispersed from the average price.
Dispersion is the difference between the actual price and the average price.
Standard deviation is also a measure of volatility.
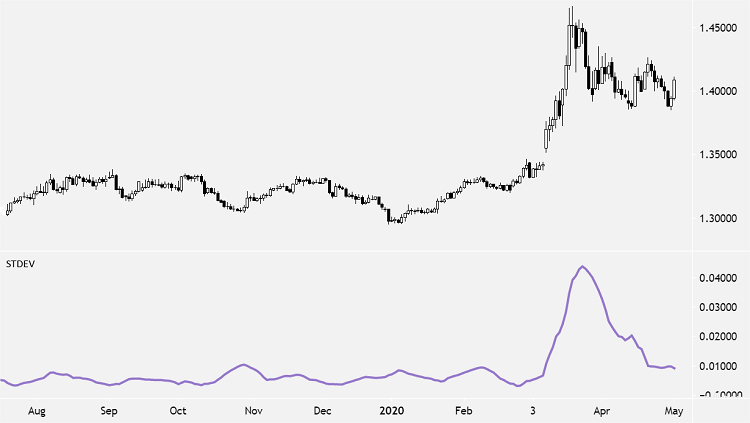
If prices trade in a narrow trading range, the standard deviation will return a low value that indicates low volatility.
If prices trade in a wide range, swing wildly up and down, then standard deviation returns a high value that indicates high volatility.
Traders use the Standard Deviation to measure expected risk and determine the significance of certain price movements.
Standard Deviation is used as part of other indicators such as Bollinger Bands. It is often used in combination with other technical analysis techniques.
How to Use Standard Deviation
Standard Deviation is a way to measure price volatility by relating a price range to its moving average.
- The higher the value of the indicator, the wider the spread between price and its moving average, the more volatile the instrument, and the more dispersed the price bars become.
- The lower the value of the indicator, the smaller the spread between price and its moving average, the less volatile the instrument, and the closer to each other the price bars become.
Standard deviation rises as prices become more volatile. As price action calms, standard deviation heads lower.
Price moves with increased standard deviation show above average strength or weakness.
- Market tops with increased volatility over short periods of time indicate nervous and indecisive traders.
- Market tops with decreasing volatility over long time frames indicate maturing bull markets.
- Market bottoms with decreased volatility over long periods of time indicate bored and disinterested traders.
- Market bottoms with increasing volatility over relatively short time periods indicate panic sell-offs.
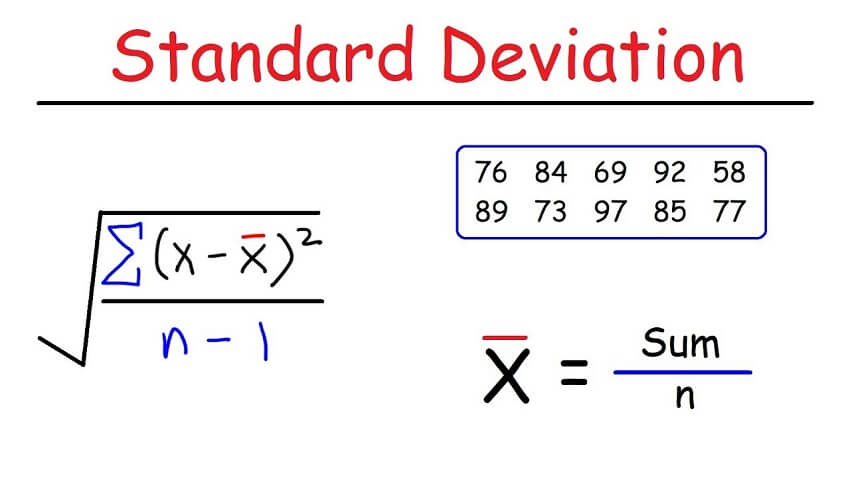
Calculation
To calculate Standard Deviation:
- Calculate the SMA for Period n
- Subtract the SMA value from step one from the Close for each of the past n Periods and square them
- Sum the squares of the differences and divide by n
- Calculate the square root of the result from Step 3
SD = Sqrt [(Sum the ((Close for each of the past n Periods – n Period SMA for the current bar)^2))/ n]
If you liked this article, then please subscribe to our Newsletter Services for Forex Related updates. You can also find us on Facebook and can subscribe to our YouTube channel. You can also join our Telegram Channel for real-time trading analysis and discussion. Here is our service sitemap. If you have any confusion please leave your comments below.


