


Stochastic Intro
The Stochastic Oscillator is a momentum indicator that shows the location of the closing price relative to the high-low range over a set number of periods.
It was developed by George C. Lane in the late 1950s. He believed that momentum changes before price so he created the Stochastic Oscillator to follow the “speed” or momentum of price.
This oscillator works on the theory that during an uptrend will remain equal to or above the previous period closing price, and in a downtrend, prices will remain equal to or below the previous closing price.
In a nutshell:
- In an uptrend, the closing price tends to close near the high.
- In a downtrend, the closing price tends to close near the low.
If the closing price starts to slips away from the high or the low, then momentum is considered to be slowing.
Stochastics are most effective in broad trading ranges or slow-moving trends.
How Stochastic Works
The indicator can range from 0 to 100.
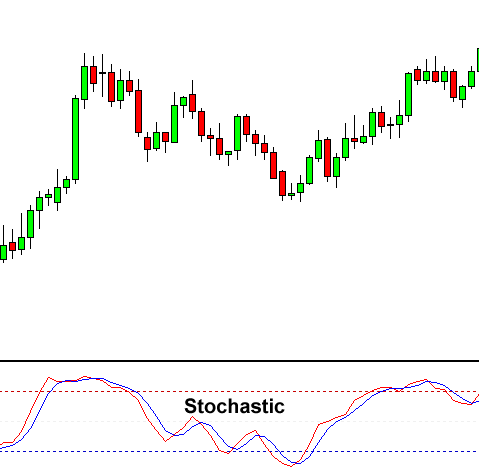
Two lines are graphed, the fast oscillating %K, and a moving average of %K, commonly referred to as %D.
The Stochastic Oscillator measures the level of the close relative to the high-low range over a given period of time.
Assume that the highest high equals 100, the lowest low equals 90, and the close equals 98.
This means that the high-low range is 10 (100-90), which is the denominator in the %K formula.
The close less the lowest low equals 8, which is the numerator.
8 divided by 10 equals .80 or 80%.
Multiply this number by 100 to find %K.
%K would equal 20 if the close was at 92 (.20 x 100).
The Stochastic Oscillator is above 50 when the close is in the upper half of the range and below 50 when the close is in the lower half.
Low readings (below 20) indicate that price is near its LOW for the given time period.
High readings (above 80) indicate that price is near its HIGH for the given time period.
How to Trade?
Overbought/Oversold Conditions
The 80 and 20 are the most common levels used. In general, the area above 80 indicates an overbought region, while the area below 20 is considered an oversold region.
- A sell signal is given when the oscillator is above 80 and then crosses back below 80.
- A buy signal is given when the oscillator is below 20 and then crosses back above 20.
Crossover Signal
A crossover signal occurs when the two lines cross in the overbought or oversold region.
- A sell signal occurs when a decreasing %K line crosses below the %D line in the overbought region.
- A buy signal occurs when an increasing %K line crosses above the %D line in the oversold region.
Divergences form when price makes a new high or low in price but the Stochastic Oscillator does NOT.
- A bullish divergence forms when price makes a lower low, but the Stochastic Oscillator forms a higher low. This indicates less downward momentum signals a potential bullish reversal.
- A bearish divergence forms when price makes a higher high, but the Stochastic Oscillator forms a lower high. This indicates less upward momentum and signals a potential bearish reversal.
Three versions of the Stochastic Oscillator exist: Fast, Slow, and Full.
Each version applies a different calculation to the value of the basic Stochastic Oscillator.
If you liked this article, then please subscribe to our Newsletter Services for Forex Related updates. You can also find us on Facebook and can subscribe to our YouTube channel. You can also join our Telegram Channel for real-time trading analysis and discussion. Here is our service sitemap. If you have any confusion please leave your comments below.


